


Basics of GPR
Ground-penetrating radar (GPR) is a geophysical method for surveying an underground environment, based on the emission of pulses of electromagnetic waves and registration of signals reflected from various objects of the probed environment. The signal is emitted by the transmitting GPR antenna, the response is received by the receiving GPR antenna
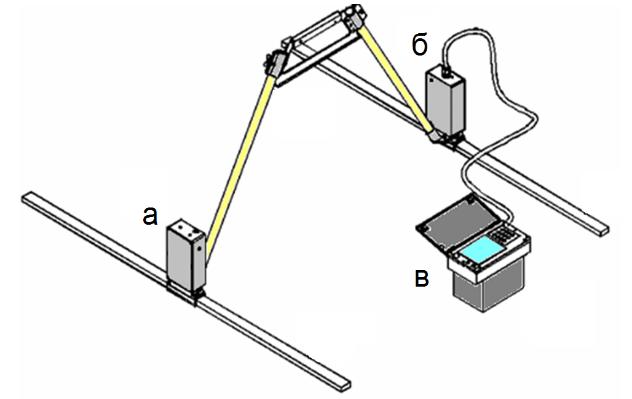
General view of the LOZA series GPR: a - transmitter; b - receiver; c - control and display unit
GPR survey can be carried out in two modifications: GPR profiling on a permanent base and GPR sounding on a variable base
GPR profiling on a permanent basis
Common offset profiling is a standard GPR survey method. A profile is outlined, which is then followed by an operator with a GPR, whose antennas of the receiver and transmitter are at a constant distance from each other
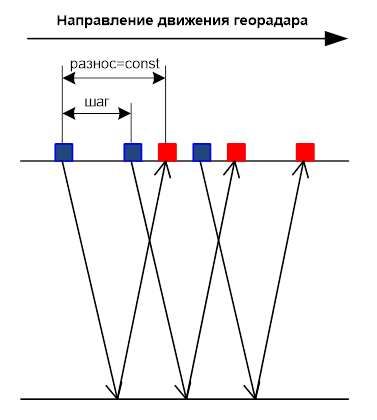
GPR profiling scheme: blue squares - transmitting antenna, red squares - receiving antenna
At a given point, the transmitting GPR antenna emits an electromagnetic signal into the medium. This signal propagates in soil and air, where it experiences various wave processes. The signal that reached the ground surface back to the receiving antenna is received and stored in the GPR memory. This path is a function of the amplitude of the incoming signal from the time of its arrival at the receiving antenna
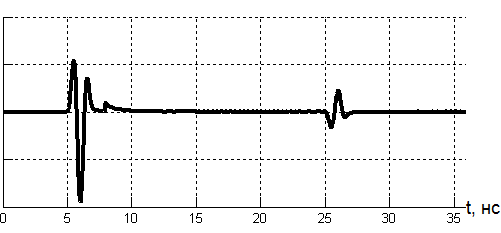
An example of an ideal path when examining a two-layer environment. The first burst of amplitudes (t = 5 ns) is associated with the arrival of a direct air wave. The second burst of amplitudes (t = 25 ns) is associated with the arrival of a wave reflected from the interface between the layers
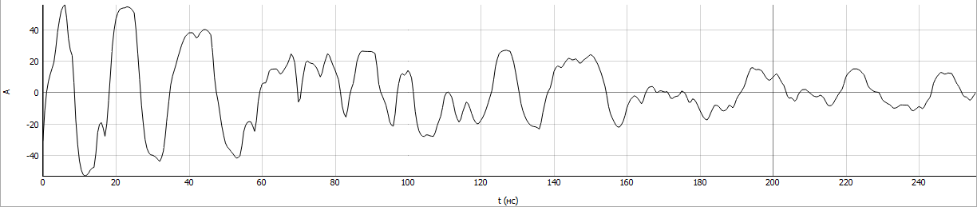
An example of a real track
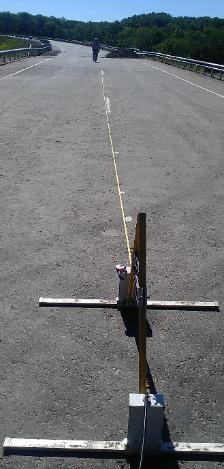
With a predetermined step (usually from 0.1 to 2 m), the GPR moves along the profile. The track is recorded at each parking lot. The resulting set of traces is called a radarogram. For convenience, the radarogram is presented in the form of an image, the horizontal axis of which corresponds to the distance from the beginning of the profile, the vertical axis is the time of signal arrival, and the color is the signal amplitude.
Each vertical section of the radarogram corresponds to a trace - the dependence of the signal amplitude on time
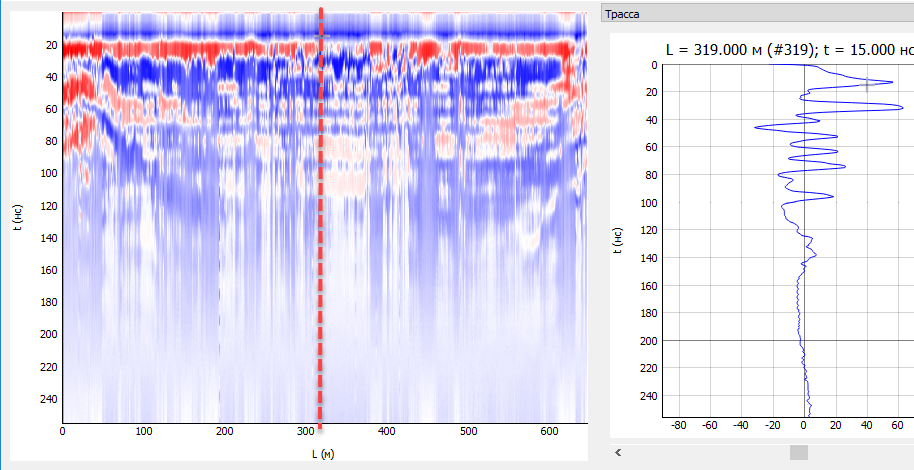
An example of a radarogram. The vertical line corresponds to the track (on the right)
Search local inhomogeneities on radarogram
In the case when there is a small local object (pipe, cable) in the probed medium, the phenomenon of diffraction occurs. This means that if there are local objects in the profile area, then on the resulting radarogram, each such object will correspond to a hyperbolic contour
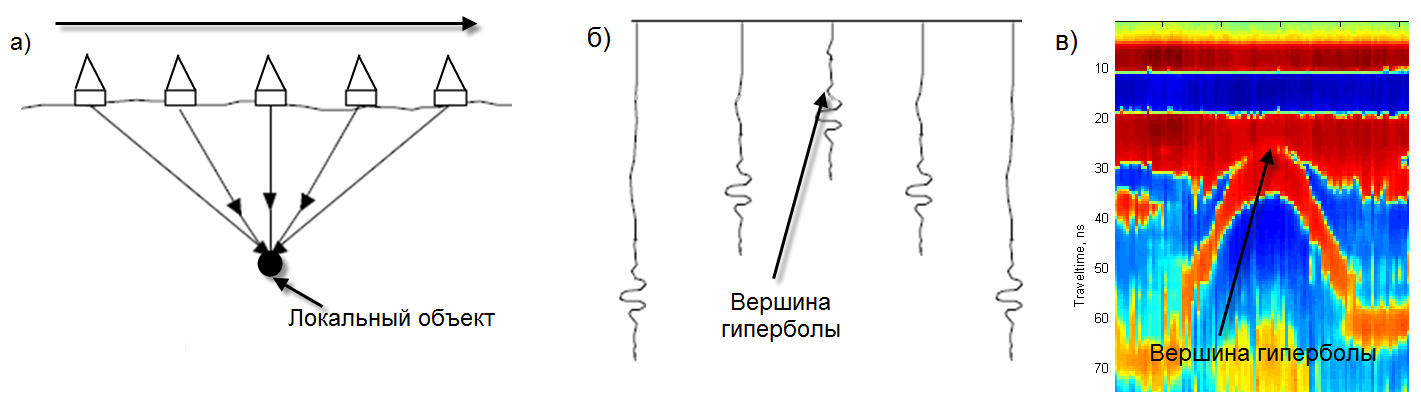
Scheme of the occurrence of the phenomenon of diffraction: a - the process of GPR profiling over a local object; b - diagram of the resulting radarogram; c - an example of a real radarogram with a diffraction hyperbola
The highlighted hyperbola can be used to determine the location of the local object (horizontal distance and depth), as well as the average speed of propagation of radio waves above the object
Converting a temporary GPR section into a depth section
The initial radarogram is a time section (the vertical axis is the time axis of the signal arrival, in nanoseconds). To solve engineering problems, it is required to find the position of the interfaces between different environments and then determine at what depth the boundaries are located, i.e. convert time section to depth
Time section: along the vertical axis - time, ns
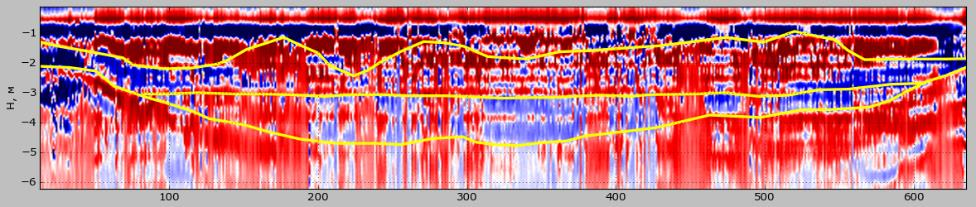
Depth section: along the vertical axis - depth, m
To transform the time section into a depth section, it is necessary to determine the speed of signal propagation in the soil media. The program includes three main methods for determining the velocity: by diffraction hyperbolas, by hyperbolic travel time curves of reflected waves and by means of amplitude analysis
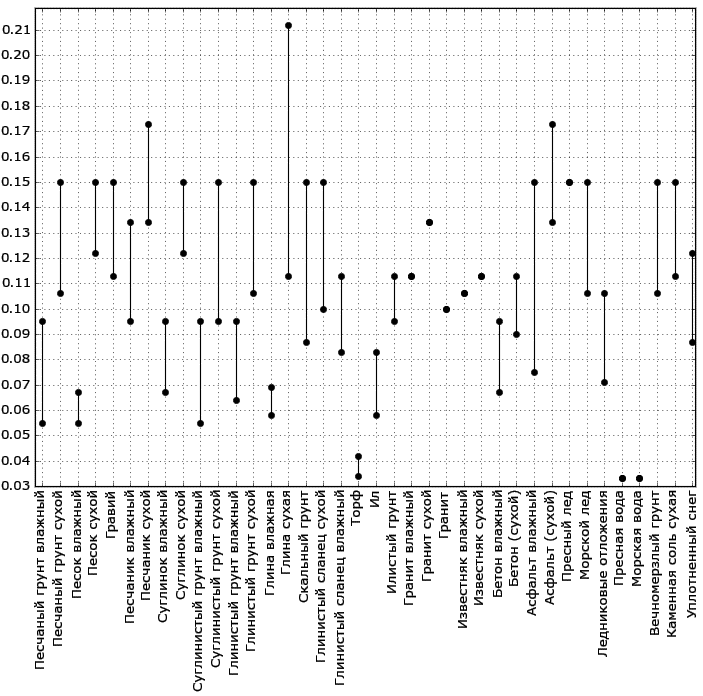 Velocity of propagation of electromagnetic waves in various soil media, m / ns
Topographic correction
If the surface on which the GPR profiling is performed is non-horizontal (for example, the cross-section of a road embankment), it is required to link the radarogram to this surface (topographic correction)
 Topographic correction result
GPR sounding on a variable base
With GPR sounding, the distance between GPR antennas gradually increases. At the same time, either the position of the GPR axis with the simultaneous separation of both antennas in different directions (CMP - common midpoint survey), or the position of one of the antennas (WARR - wide-angle reflection and refraction method) can remain unchanged. The section at which the distance between the receiver and the transmitter is equal to zero is called the hodograph axis
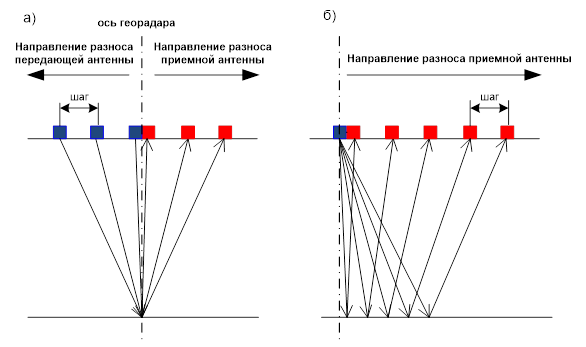 GPR sounding scheme: a - CDP (CMP); b - WARR; blue squares - transmitter position, red squares - receiver position
This test is carried out in order to build a soil model at a given point, i.e. determine the depth and speed of propagation of radio waves for each layer. On the radarogram, a set of hodographs of various electromagnetic waves can be distinguished: direct air, direct soil, reflected, refracted
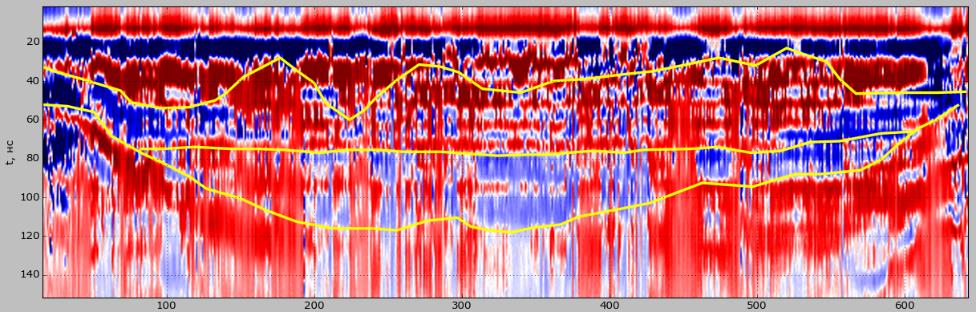
To build a soil model, as a rule, only traveltime curves of reflected waves, which have a hyperbolic shape, are used. The program includes a unique method for analyzing the travel time curves of reflected waves, with the help of which the soil model is calculated
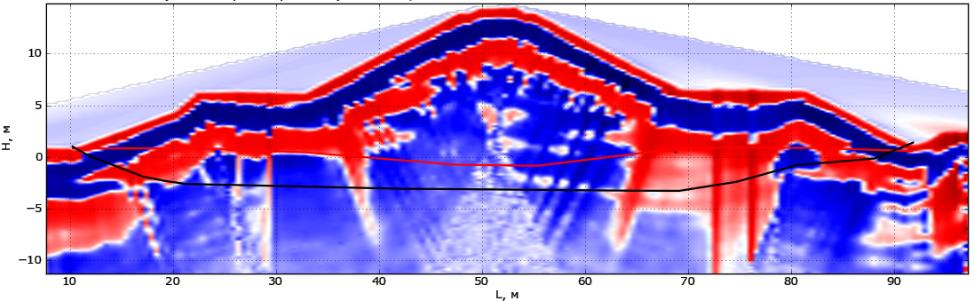
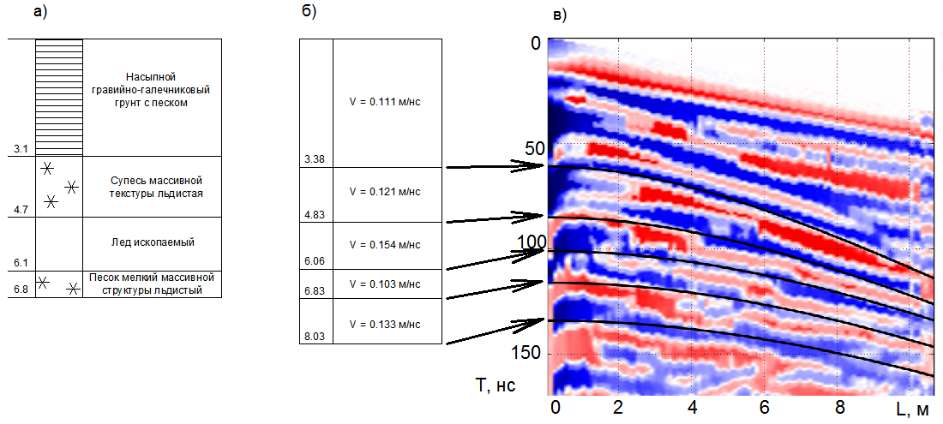 a - engineering-geological section; b - soil model built in the program; c - radarogram obtained after GPR sounding in the control section; hyperbolic travel time curves of waves reflected from the boundaries between layers are identified
Determination of propagation velocities of radio waves using amplitude analysis
The method consists in the fact that before the direct GPR survey at the site, a GPR test is carried out on a metal plate, from which the electromagnetic wave will be fully reflected
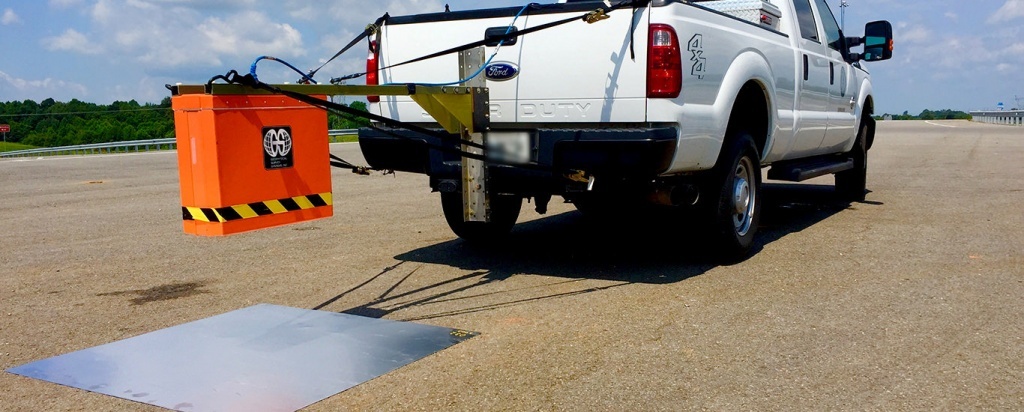 Testing on a metal plate
On the obtained radarogram, the reflection from the surface is distinguished, its amplitude Am is determined for different time readings:
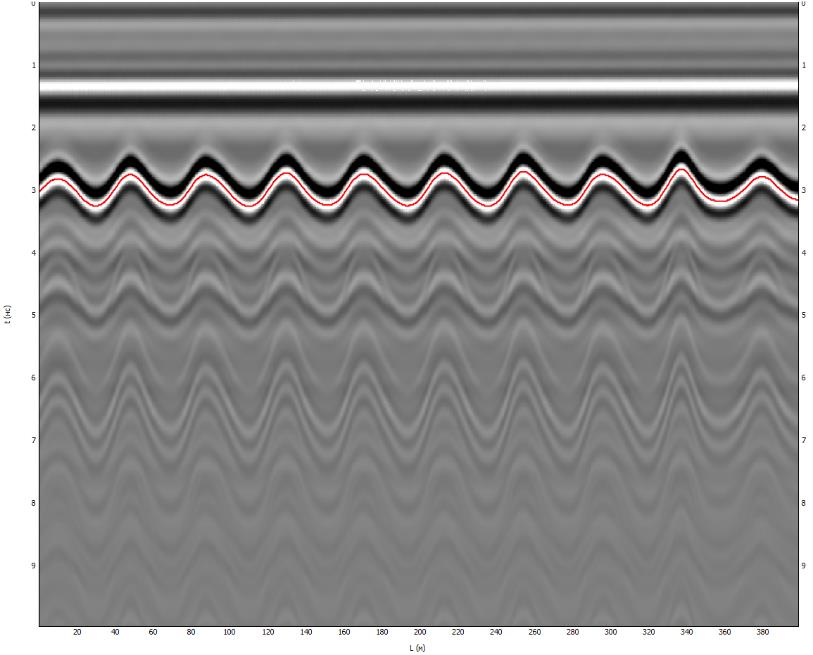 Radarogram obtained after testing on a metal plate
Knowing the amplitude Am, the relative permittivity in the first layer ε1 can be determined by the formula:
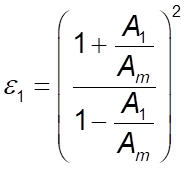 where A1 is the amplitude of the wave reflected from the ground surface
Amplitude maps
In the case of using three-dimensional GPR, or during a GPR survey with a grid of longitudinal and transverse profiles, the task of three-dimensional analysis of the results of GPR survey arises
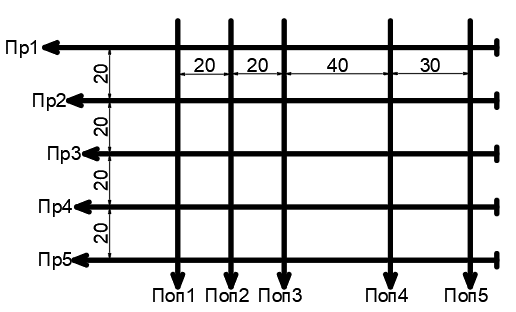 An example of performing areal GPR surveys in the form of a grid of longitudinal and transverse georadar profiles
When processing such radarograms, it often makes sense to look at the data of all radarograms in a certain section (at a certain depth). For this, an amplitude map is built:
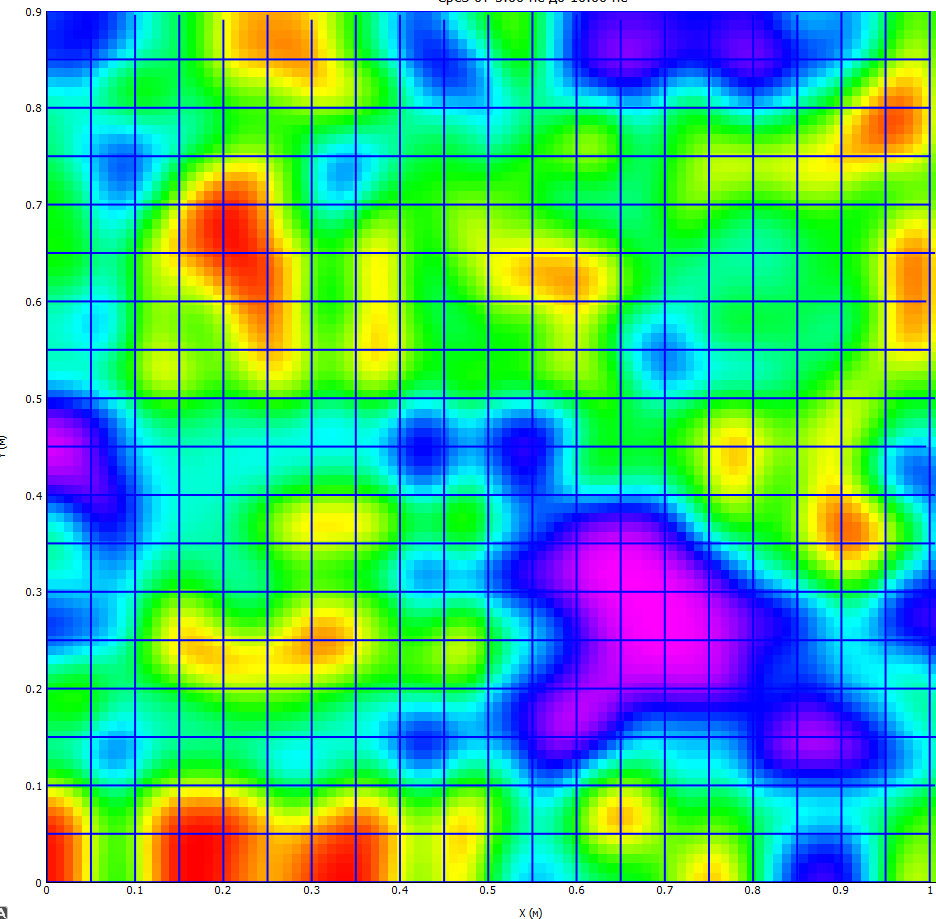
An example of an amplitude map