


About the R&D stage
Probably, like many other companies in Russia, we started our journey with scientific work - R & D, supported by the Foundation for Assistance to Small Innovative Enterprises (FASIE)
When performing surveys of roads using GPR, we often faced complex engineering challenges in the processing of GPR data. For example, this could be the appointment of a well according to the radargram data and its positioning on the ground, the processing of large amounts of data in terms of identifying the boundaries laid layers of road structure, or the identification of heterogeneities (destructive processes) on the radargrams
We knew about the problems of road surveys using a geophysical device - ground penetrating radar (more about the technology and principles of operation of the device can be found on the page BASICS OF GPR). So, the processing of radargrams (data obtained by scanning the subsurface structure with a GPR) with the preparation of reports took a lot of time - at least 1 month when working with a site 15-20 km long, or even there was no technical possibility of obtaining such specific information as, for example, the thickness of the structural layer in coordinate and picket referencing, or the localization of heterogeneities, wells in comparison with the radargram
In various countries, the GPR method is now widely used. Programs for processing GPR data contain a wide range of functionality for working with a GPR project. Along with this, we conducted a marketing study and determined that most foreign products are either optionally tied to specific equipment (GPR), or very expensive and incomprehensible to the Russian user. At the same time, kits (GPR + software) of domestic developers, as a rule, do not contain the amount of functionality that is necessary to work with a GPR project at road construction sites
To create our own software, universal, with wide functionality for working with a GPR road scanning project at each stage of its life cycle, resources were needed - a programmer and basic software for further development
The co-founders of the TIM company, Roman Eremin and Yuri Sukhobok (the author of the GeoReader software), met at the Georadar-2017 conference and agreed there for the first time on further developments, in the directions of which Roman and Yuri were in full agreement, as experienced GPR operators and scientists. So the GeoReader software was chosen as the basis for further development
Yuri started developing the first versions of programs for GPR data processing from the moment of his first acquaintance with the Python programming language - approximately from the middle of 2013. Until 2017, the GeoReader program was compiled in the form of separate simple mathematical functions written in Python. And already in 2017, the first opportunity to increase the level of software appears - Yuri took advantage of the program of the Foundation for Assistance to Small Innovative Enterprises (FASIE) and took part in the UMNIK program. As a result, during the year, the first GeoReader software product was created and registered with Rospatent:
The first version of the GeoReader software supported a small set of functions for opening and working with GPR data, however, algorithms for computer vision and digital signal processing, support for data formats of various GPRs, export of GPR profile interpretation results to various formats with an open specification (in including for data exchange with CAD and GIS applications), etc
The development of GeoReader as a software package was continued in 2019 as part of the Start program (FASIE), as a result of which two applications were developed and registered, which today make up the most important functionality based on GeoReader software - this is an "Application for automated search for boundaries on radargrams" and "Application for automatic search for structural anomalies on radargrams":
At the same time, the idea of dividing the software package into two blocks was implemented - processing one radargram (GeoReader) and batch processing of all files / radarograms of the georadar project (GeoReader Project)
As part of R&D, the project team carried out extensive work to develop new software solutions and test new data processing algorithms
An application for automated search for boundaries on the radargram (when the operator sets the starting point on the first GPR track of the radargram and, if necessary, corrects the operation of the autosearch algorithm) and a fully automatic search for structural inhomogeneities (anomalies) on the radargram using attributive analysis technology (determination of the dynamic parameters of the wave pattern, aimed at obtaining additional information about the structure of the section) qualitatively supplemented the GeoReader software package
So, in order to build the most efficient algorithm, taken as a basis in the "Application for automated search for boundaries on radargrams", four most effective models for determining boundaries were developed:
- by extreme values (with the most optimal settings)
- algorithm based on cross-correlation function
- matching colors
- in equal phases
A little about the progress of development and testing..
The comparison of the developed algorithms was carried out according to two criteria: speed and stability
The calculation of the operating time was performed by searching for three boundaries: the reflection from the metal sheet, the reflection from the asphalt surface for the section of the road in operation, and the reflection from the asphalt surface for the section of the new road. For each algorithm, the total time, the time to complete the preparatory stage, and the average time for one GPR track were determined
An analysis of the calculation results showed that the fastest algorithm is to search for a border using similar colors (no more than 2 seconds in the worst case). The use of algorithms based on equal phases and on the basis of the cross-correlation function seemed to be quite acceptable: the operating time in the worst case did not exceed 5 seconds. However, the use of the extreme value algorithm turned out to be unacceptable: the running time in this case was up to 2.5 minutes
The stability criterion of the algorithm in this context means how many times the operator needs to intervene in the process of the algorithm in order to correct the failure in determining the position of the boundary. The more such interventions, the less stable the algorithm. This can happen due to four reasons: stopping the search algorithm, skipping the section of the radargram by the algorithm, finding a local outlier on the boundary that needs to be corrected, and switching to another in-phase axis
The calculation was carried out when searching for two boundaries on the section of the operated highway (reflections from the asphalt surface and from the first asphalt concrete layer) and when searching for four boundaries on the section of the new highway (reflections from the asphalt surface, asphalt concrete sole, layer of crushed stone mixture and sand)
The calculation results showed that for a new road with well-defined layers, all algorithms are quite stable. The algorithm for equal phases proved to be preferable, because when working with it, only transitions to another in-phase axis appear, no other violations were detected. However, for a road in operation, where the layers are not so obvious, it turned out to be unacceptable to use algorithms based on extreme values or on the basis of a cross-correlation function: the number of operator interventions in this case was in the tens and hundreds. In this case, the search algorithm for equal phases also turned out to be more preferable than the search algorithm for similar colors: for it, almost no other defects were observed except for the transition to another in-phase axis
We also checked the adequacy of the obtained results. All algorithms in areas where there were no gaps, local emissions or transitions to another in-phase axis worked adequately: the boundary was built approximately in the same place where the operator would have drawn it manually
Thus, a comprehensive comparison of the developed algorithms for semi-automatic boundary search has clearly shown that the most optimal is the equal-phase boundary search algorithm. In most cases, it is also possible to use the search algorithm for similar colors, provided that the contrast of the radargram is correctly adjusted at the beginning of work. The search algorithm based on the cross-correlation function was rejected: despite an acceptable operating time, in some cases (for example, on an operated highway) it leads to a large number of failures and requires frequent operator intervention. And, finally, the extreme value search algorithm was categorically rejected, based on both the running time and the quality of the results obtained
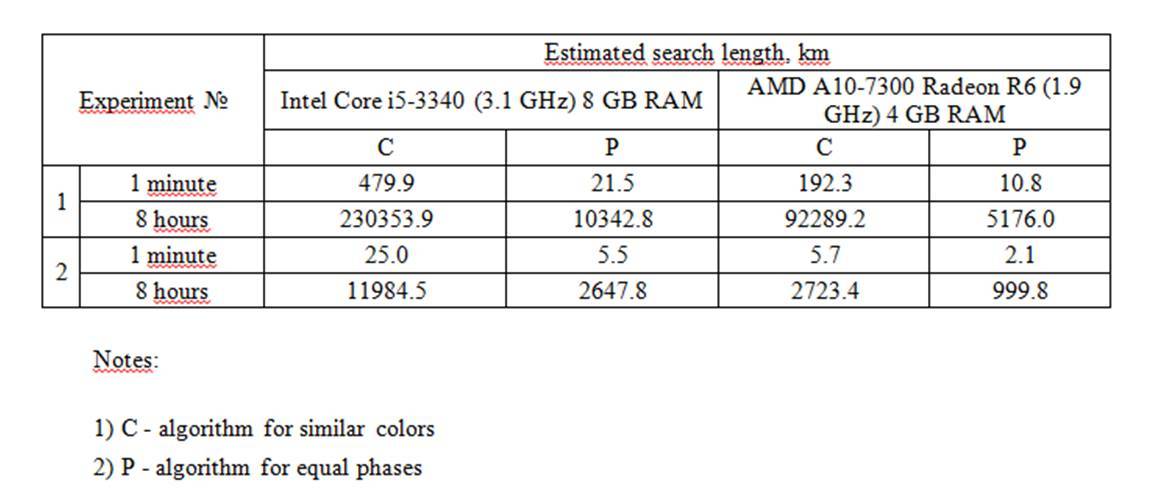
Based on the analysis of the results of comparing algorithms by the performance criterion, for the most promising algorithms for similar colors and equal phases, data were calculated on the possible length of the boundary, which can be automatically found by applying them in 1 minute and a work shift (8 hours of continuous operation) at a step scan 0.3 m
As part of the second stage of R&D, the main approaches to the automated search for structural anomalies on GPR profiles were analyzed. The analysis showed that the most feasible is the use of attribute analysis algorithms
Promising areas are also identified for determining the location of structural anomalies using the common depth point method, creating algorithms using deep learning technology to automatically classify defects detected by the results of the search for structural anomalies
During the experimental part, it was found that:
1. Automatic attribute analysis algorithms for quantitative changes in attributes are able to detect zones of structural anomalies that are visible to the human eye. At the same time, machine vision allows you to see a greater number of structural anomalies compared to an expert
2. For the detection of emptiness and overmoistening on the basis of the experimental work performed, the most indicative is the texture analysis procedure "Measure of uniformity"
3. To detect drawdowns on the basis of the performed experimental work, the most indicative is the texture analysis procedure "Measure of contrast"
4. Most of the attribute analysis procedures are applicable to detect soil weakening of various nature based on the experimental work performed
At the same time, in the course of R&D, it was noted that work with a georadar in each specific place can be unique, since the result of field survey and cameral processing depends largely on both the weather and climate conditions of the area and the physical composition of the surveyed environment, and the means used data collection and processing, including GPR settings and applied software functions
As part of the 3rd stage of R&D, it was established that at the end of R&D, the maximum estimated performance of automated algorithms for searching for the boundaries of pavement layers was 76.46 km of a GPR profile per shift, and the maximum estimated performance of automated algorithms for structural anomalies searching in pavements was 72.58 km GPR profile per shift