


Road survey with GeoReader software
Since its inception, TIM LLC has been developing, developing and promoting GeoReader software on the Russian market - a special program for automated processing and interpretation of large volumes of ground penetrating radar (GPR) scanning data
Of course, GeoReader allows you to solve other problems related to the use of GPR, but still, the greatest experience of successful application is associated with roads and other transport infrastructure facilities (railways, airport complexes). Today, among the users of GeoReader there are design and survey and research organizations whose activities are closely related to the road industry
In order to answer the question of an inexperienced user - "what is the difference between GeoReader and similar software products?", We will share our work with you, dear visitors of our site
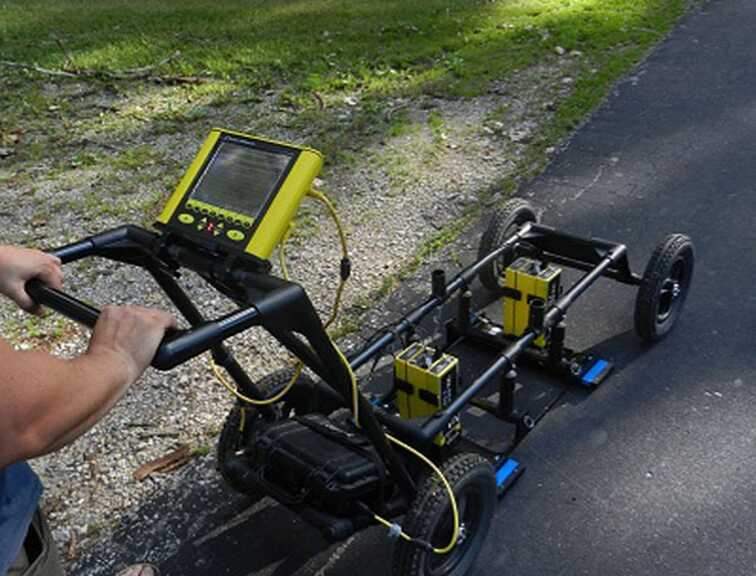
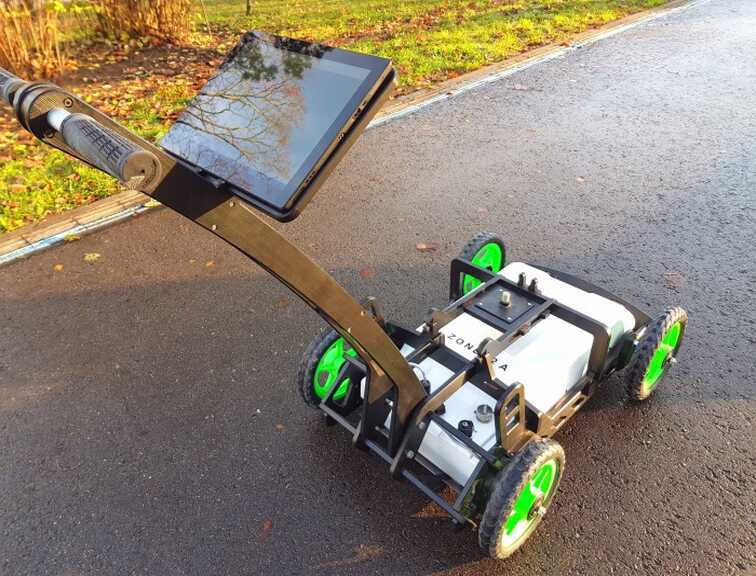
The GeoReader software package is a multi-format software that supports data from GRT and OKO (Figure 1), Loza (Figure 2), GSSI, Mala, S&S and Zond (Figure 3) GPR series

а) б)
Figure 1 - GPR series GRT (a) and OKO (b)
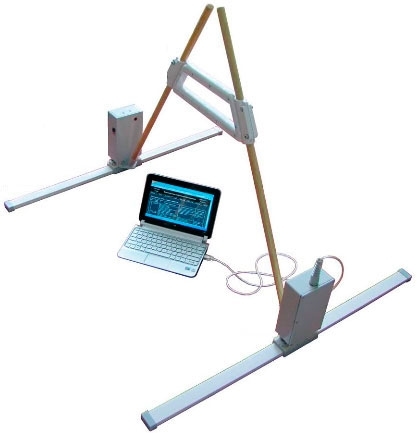
Figure 2 – Loza GPR
a) b)
c) d)
Figure 3 - GPR GSSI (a), Mala (b), S&S (c) and Zond (d)
The GeoReader software package allows you to solve the following tasks when inspecting roads:
- control of thickness, uniformity of thickness and properties of pavement materials and subgrade soils in accordance with GOST R 58349-2019 “Public automobile roads. Road clothes. Methods for measuring the thickness of pavement layers" and ODM 218.3.075-2016 "Recommendations for quality control of road construction works by GPR"
- determination of ice thickness on winter roads and assessment of the bearing capacity of ice crossings in accordance with GOST R 58948-2020 “Public automobile roads. Roads automobile winter and ice crossings. Technical rules for arrangement and maintenance” and ODM 218.4.030-2016 “Methodological recommendations for assessing the carrying capacity of ice crossings”
- assessment of the strength of pavements in accordance with the GOST R project “Public automobile roads. Methodology for assessing the strength of non-rigid pavement"
Since recommendations for performing GPR surveys and methods of work are described on the page Normative and technical support of GPR works, we will skip this question in this topic. You can briefly get acquainted with the capabilities of the GeoReader software package on our YouTube channel
In 2021, we completed road surveys in the regions of Russia, as well as in Moscow
The tasks that the hardware and software systems faced (as part of the GeoReader software):
1) assessment of the road structure condition in order to determine the causes of the rut of the newly repaired pavement (regional city roads)
2) determination of the reasons for the pavement failure in a dedicated lane for public transport and the search for other potential places for the formation of failures (urban roads in Moscow)
In the course of the first work (in the region), in order to solve the problem, it was necessary to evaluate the internal structure of the road structure, namely, to determine the consistency of the layered structure, calculate the coefficient of thickness variation and find areas of heterogeneity in the properties of the materials of the pavement layers
When solving problems, the recommendations of ODM 218.3.075-2016 were used. In accordance with the document, georadar control reveals sections of roads with possible violations in the thickness of the layers and the uniformity of properties (humidity and density) of the materials of the layers of the base of the road pavement and subgrade soils. According to the results of georadar work, a preliminary assessment of the uniformity of the properties of the materials of the base of the pavement and subgrade soils is carried out. The final assessment of homogeneity is established based on the results of laboratory tests of selected samples in places determined by the results of georadar measurements
Field GPR-works was carried out jointly with LLC SPC "Geotech". In the course of the work, GPR equipment "OKO-3" manufactured by LLC "Logic Systems" was used. At the preliminary stage of work, a reconnaissance survey and an assessment of the condition of the road surface were carried out
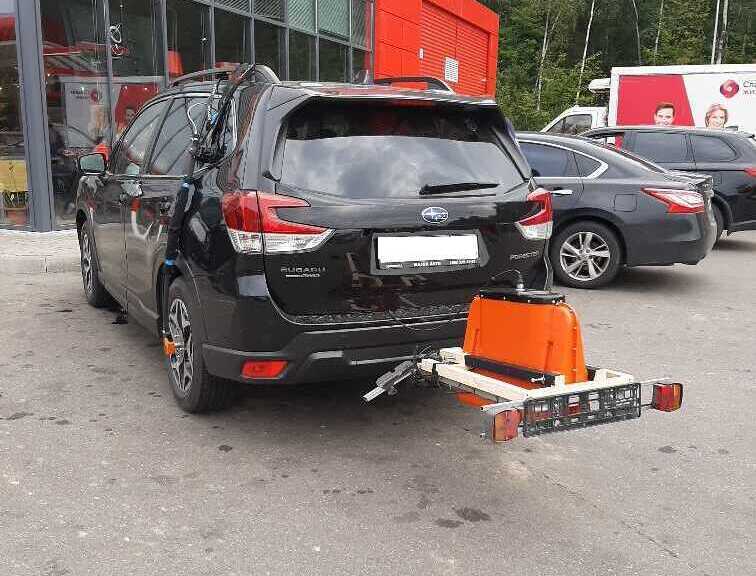
GPR survey was performed using non-contact antenna units with a frequency of 2000 MHz and 1000 MHz (Figure 4). The maximum scanning depth was achieved by the 1000 MHz antenna unit and amounted to 1.3 m
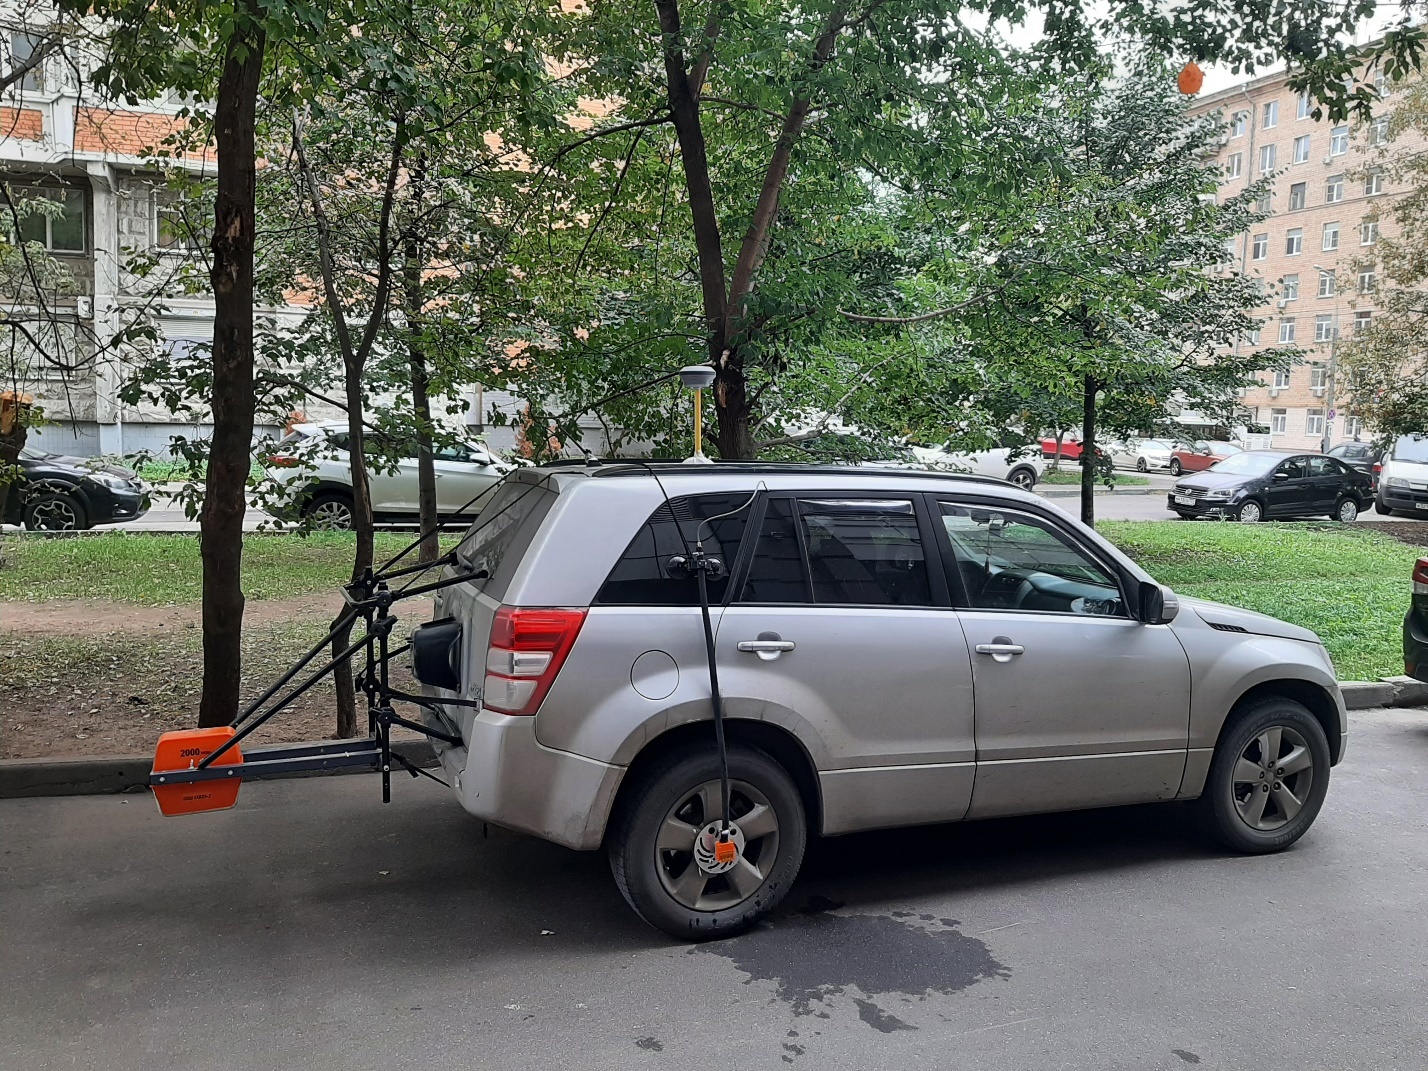
Figure 4 - General view of the GPR equipment complex based on a car
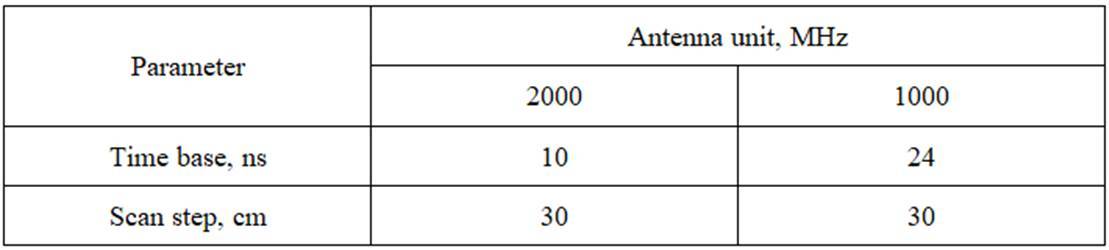
Survey parameters and equipment are presented in Table 1
Table 1 - Parameters of survey by GPR OKO-3
The collection of GPR data was carried out on the right side of the traffic lane in one direction of the surveyed area
GPR profiles were geo-referenced using EFT M4 GNSS satellite equipment in RTK mode in local coordinate system. The GPR trajectory was recalculated to the value of the longitudinal displacement between the phase center of the satellite receiver antenna and the GPR antenna unit, the distance between which in the longitudinal direction was 1.7 m. There was no transverse displacement of the antennas
The data processing technique is represented by the indicated operations:
1) Analysis of raw materials
2) Formation of GPR projects, which included a set of GPR profiles recorded in the selected area
3) Importing the planned coordinates of the GPR passage points and shifting the GPR trajectory from the phase center of the satellite equipment receiver towards the GPR antenna unit
4) Interpretation of GPR profiles:
a) drawing the boundaries and analyzing the uniformity of the thickness of the pavement layers
b) expert analysis of the uniformity of properties of pavement layers
c) manual vectorization of heterogeneous areas on GPR profiles
d) analysis of the uniformity of properties of pavement layers using automatic attribute analysis algorithms in GeoReader software
e) search and vectorization of anomalies on GPR profiles using computer vision algorithms
5) Preparation of graphic materials and reporting forms:
a) export of tables of relative changes in the thickness of pavement layers and calculation of the coefficient of variation for them
b) export of sheets of anomalies location in tabular form with coordinate referencing
c) export of images of interpreted radarograms and sections of the cartographic substrate with the location of anomalies plotted
6) Report preparation
When performing cameral work, the procedures for subtracting the direct transmission signal, amplifying and filtering the reflected signal were applied
From the GeoReader software were exported of statements of relative changes in the thickness of pavement layers after semi-automatic drawing of the boundaries of the structural layers of pavement, as well as the calculation of the coefficient of variation in the thickness of the layers in accordance with ODM 218.3.075-2016
The method for analyzing the uniformity of the properties of pavement layers using automatic attribute analysis algorithms in the GeoReader software, as well as the search and vectorization of anomalies on GPR profiles using computer vision algorithms, was performed in the following sequence:
1. Calculation of signal and image attributes on GPR profile. As part of this stage of office work, 26 different attributes were calculated. The results of the calculation were analyzed for compliance with the criteria of clause 7.8 of ODM 218.3.075-2016. The attribute analysis algorithm "Texture analysis - Homogeneity measure", which made it possible to obtain the most characteristic calculation results for further search and vectorization of anomalies on GPR profiles using computer vision algorithms, was applied to all GPR profiles of the project
An example of the operation of the "Texture Analysis - Measure of Homogeneity" algorithm is shown in Figure 5
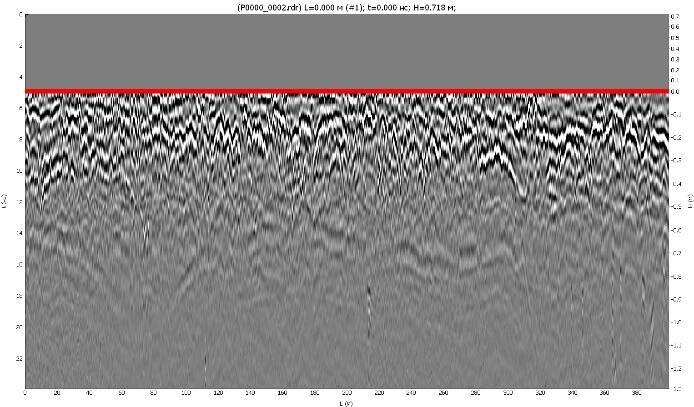
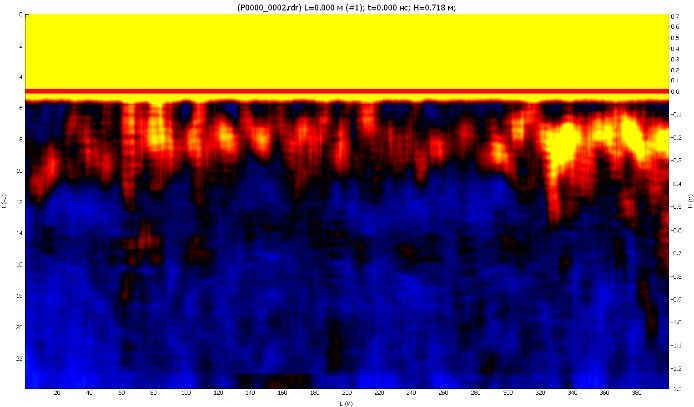
а) original radargram б) attribute analysis result
Figure 5 - An example of the operation of the algorithm "Texture analysis - Measure of homogeneity"
2. Search and vectorization of anomalies on GPR profiles using computer vision algorithms. At this stage of the work, the results of attribute analysis were binarized using the "Texture Analysis - Measure of Homogeneity" algorithm. After binarization, segmentation and automatic vectorization of areas corresponding to the criteria of clause 7.8 of ODM 218.3.075-2016 were performed
An example of the operation of computer vision algorithms is shown in Figure 6
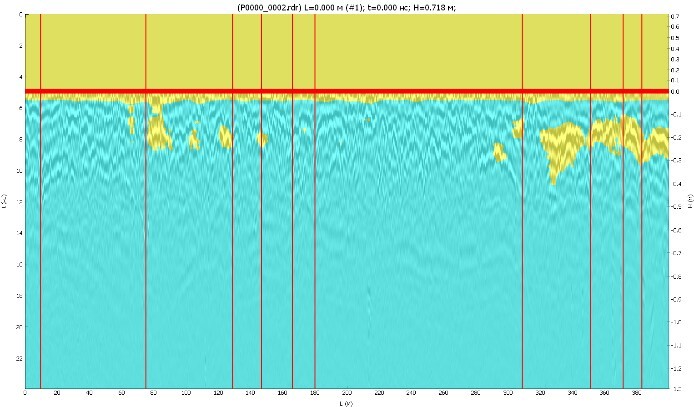
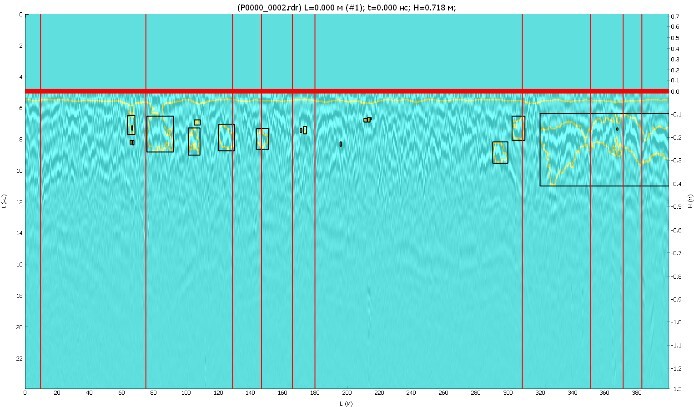
а) radargram binarization б) Segmentation, automatic search and vectorization of anomalies
Figure 6 - An example of the operation of computer vision algorithms
The analysis of the results of the GPR survey was carried out according to the data of an expert assessment, as well as the work of automatic algorithms of the GeoReader software
The main violations of the internal structure of the surveyed area are associated with the presence of subsidence of the reflecting boundaries of the pavement layers, the termination of traceability of the reflecting boundaries, and a chaotic wave pattern (Figure 7). As a rule, such signs are often observed in urban environments and are prerequisites for the formation of defects on the road surface, up to the formation of dips and air cavities in the layers of the base of the pavement
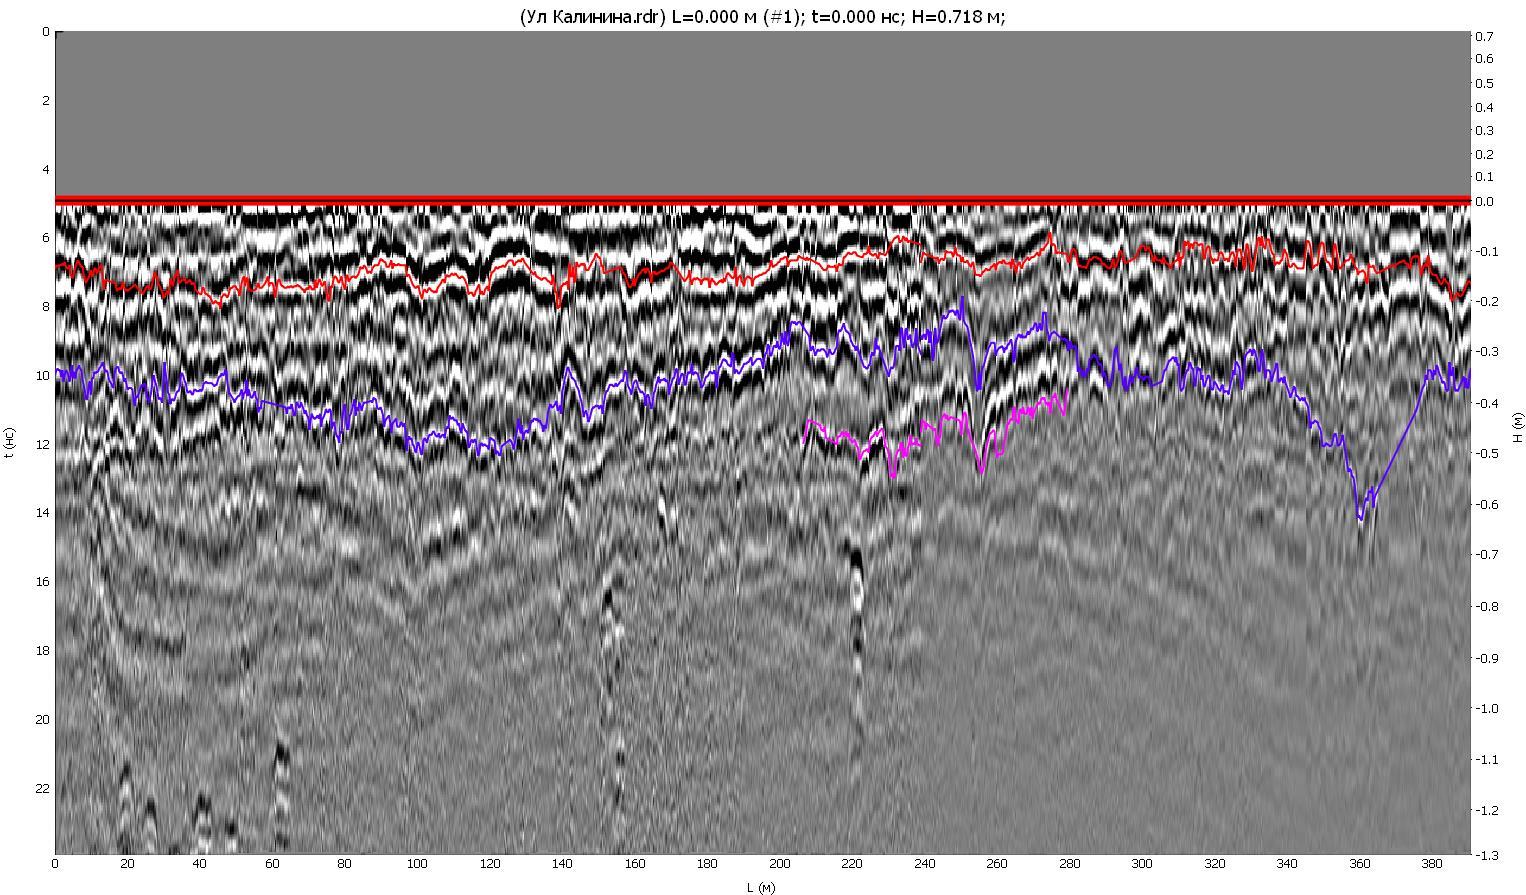
Figure 7 - Radargram of the surveyed area with interpreted boundaries of pavement layers
The soles of the layers corresponding in depth to asphalt concrete are marked with a red line, the upper layers of the base - a blue line, the lower layers of the base - a purple line. It can be seen that the reflections from the sole of the lower layers of the base are not visible throughout. The absence of reflections from the sole of the lower layers of the base also indicates the absence of differences in the properties of the soils of the base of the pavement and the natural base, which indirectly indicates a discrepancy between the drainage properties. As a rule, such a situation leads to the accumulation of groundwater under the pavement and frost heaving during the winter redistribution of moisture. Air temperature transitions through 0 in winter have a detrimental effect on the strength of pavements. Repeated processes of heaving and subsidence violate the integrity of the pavement layers and lead to local decompaction, in which weakened zones subsequently form
In some places, the GPR profiles showed the absence of a pronounced layered structure, which is typical for the pavement of highways. As a rule, such signs are often observed on sections of city roads and streets, which are regularly subjected to the negative impact of water-bearing engineering communications, local repairs and excavations of the soil of the pavement base. For greater clarity, Figure 8 shows a fragment of a GPR profile recorded on a newly constructed road. The profile is characterized by a clearly defined layered structure. There are no additional reflections in the space between the sole and top of the layers, and the interfaces between the layers are comparatively more uniform in thickness. The contrasting difference of the wave pattern in Figures 7 and 8 indicates the accumulation of fatigue strains in the pavement layers of the surveyed area, which most likely will lead to a decrease in strength properties. As part of the study, only a non-destructive survey was performed using GPR, but for a more in-depth study of the state of the object, it is also recommended to measure the deflection bowl with shock loading installations, for example, systems of the FWD type
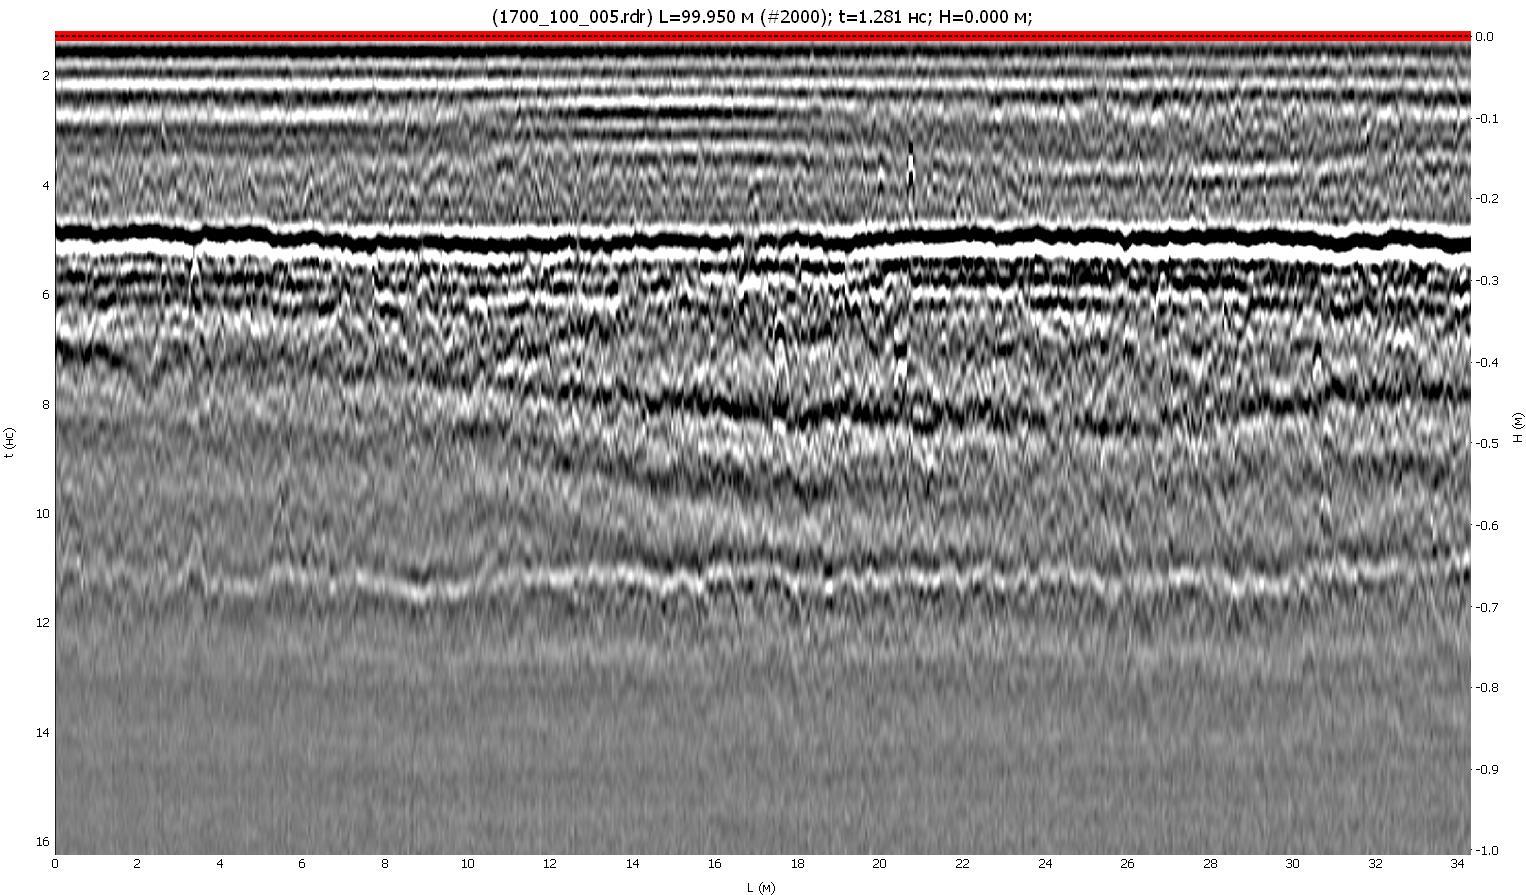
Figure 8 - An example of a GPR profile of a newly constructed pavement
For all rendered layers, the thickness variation coefficient was calculated in accordance with ODM 218.3.075-2016. The calculation results showed an excess of the recommended parameters for all layers of pavement by 200 to 500%. This indicates how much the existing pavement differs from the recommended conditions under which the long-term operation of the structures of the structure is ensured
Also, based on the results of the GPR survey, it was concluded that almost throughout the surveyed sections there are inconsistencies in the uniformity of the properties of the materials of the layers of the pavement base in accordance with paragraph 7.8 of ODM 218.3.075-2016
At the facility in the capital region, signs of weakened zones of pavement base were determined the sites of pavement failure, guided by the signs found, it was necessary to find other potentially dangerous places at the facility. The field work was carried out in several stages and with two different types of equipment: an OKO GPR (Logic Systems LLC) with several antenna units and a GRT-XX georadiotomograph (NPO Terrazond LLC) with antenna units in two variations of frequency band settings. We will say more about the equipment below
Stages of field work:
1) reconnaissance survey of traffic lanes using a GRT GPR
2) inspection of traffic lanes using OKO GPR (Figure 9)
2) inspection of the sidewalk next to the roadway with the OKO GPR
4) inspection of the sidewalk next to the carriageway by the GRT GPR
5) re-survey of traffic lanes using GRT GPR (Figure 10)
Figure 9 - Survey of traffic lanes using OKO GPR (antenna unit 1000 MHz)

Figure 10 - Inspection of traffic lanes using GRT GPR (antenna units 200-1200 MHz and 500-2500 MHz)
The surveys were carried out in November-December 2021. In all cases, the weather for the work was favorable, no significant negative factors were observed. However, due to the previous processes of autumn moisture accumulation in the base of the road structure, the scanning depth was less than in the favorable summer period. In order to minimize interference with traffic and pedestrians, all work was carried out in the evening and at night
At the first stage, the georadar survey was carried out using the Russian georadar of the OKO series (manufactured by Logic Systems LLC) and a non-contact antenna unit with a center frequency of 1000 MHz (Figure 9), as well as using a contact antenna unit with a center frequency of 700 MHz (Figure 11) . GPR trajectories were recorded in a georeferencing file using satellite equipment. During the survey, data from the 700 MHz antenna unit made it possible to scan the road structure and the underlying base to a depth of about 1.5 m. The antenna unit with a center frequency of 1000 MHz made it possible to evaluate the change in the thickness of the pavement layers with high resolution
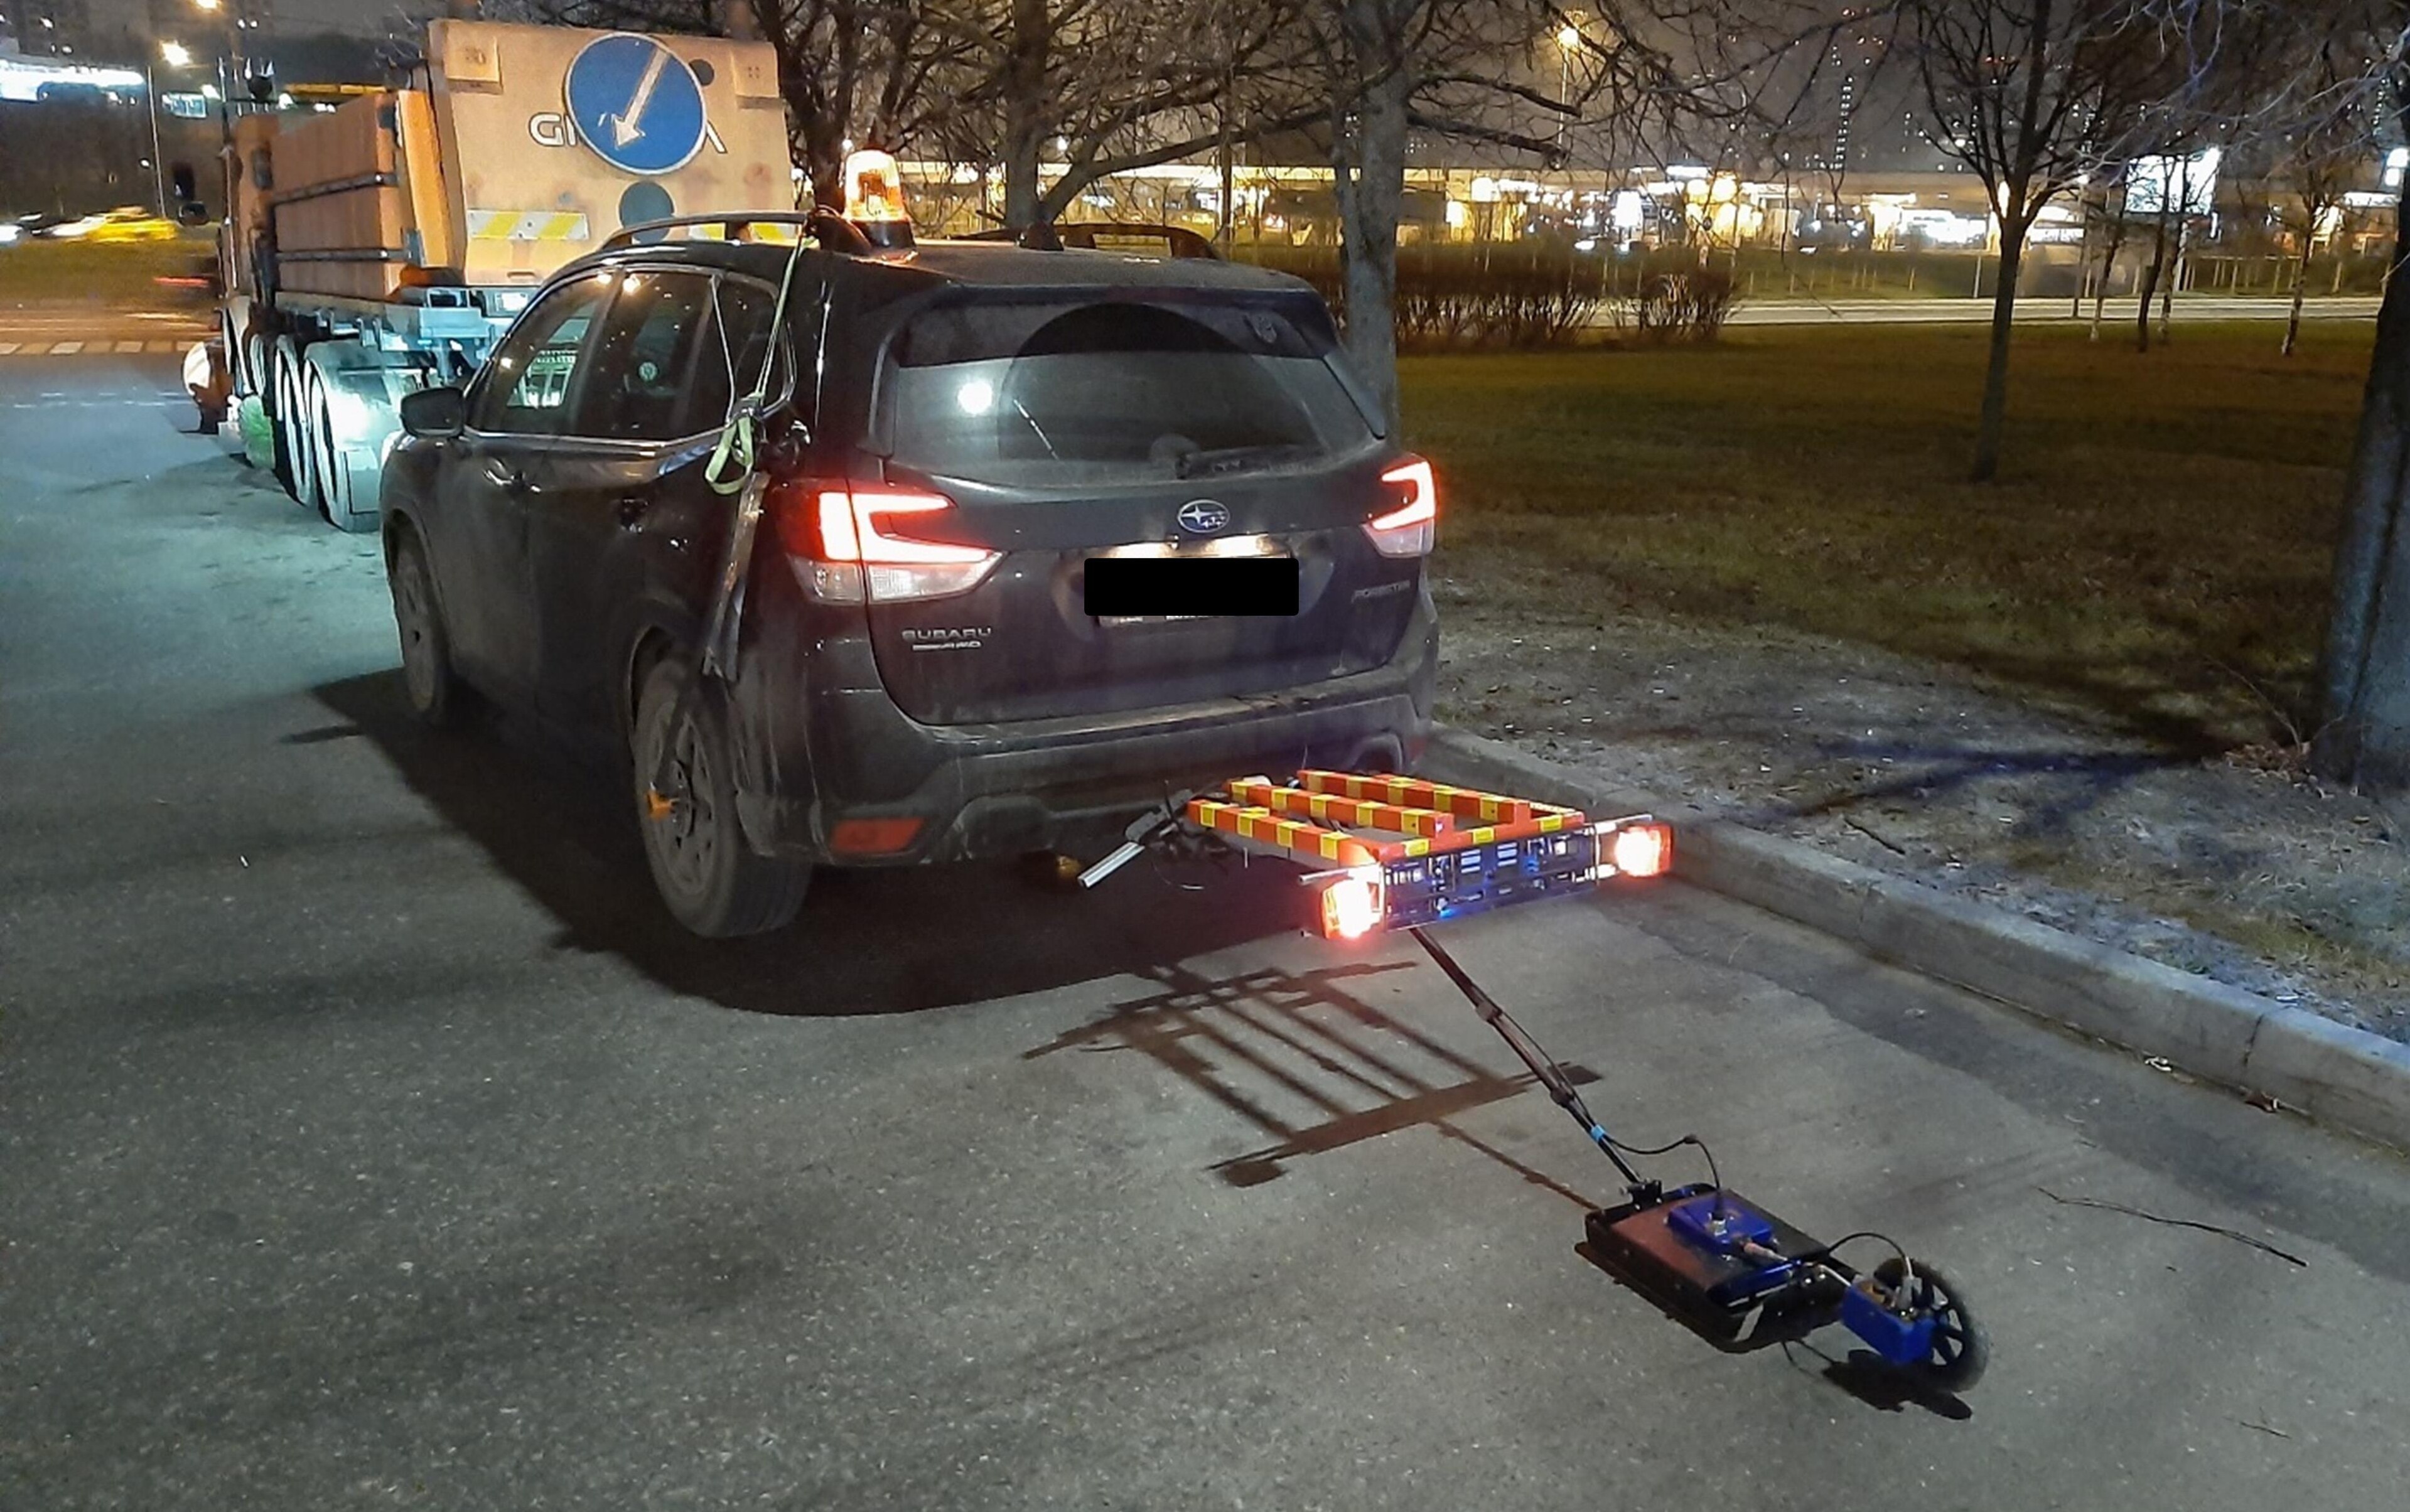
Figure 11 - GPR survey using OKO GPR (700 MHz)
A feature of the used OKO-3 GPR is the ability to obtain a vertical electromagnetic section (GPR profile) only in the projection where the antenna unit was towed. For this reason, in order to study the condition and structure of the road structure at a certain width of the carriageway, driveways with GPR were made along several lanes (Figure 12)
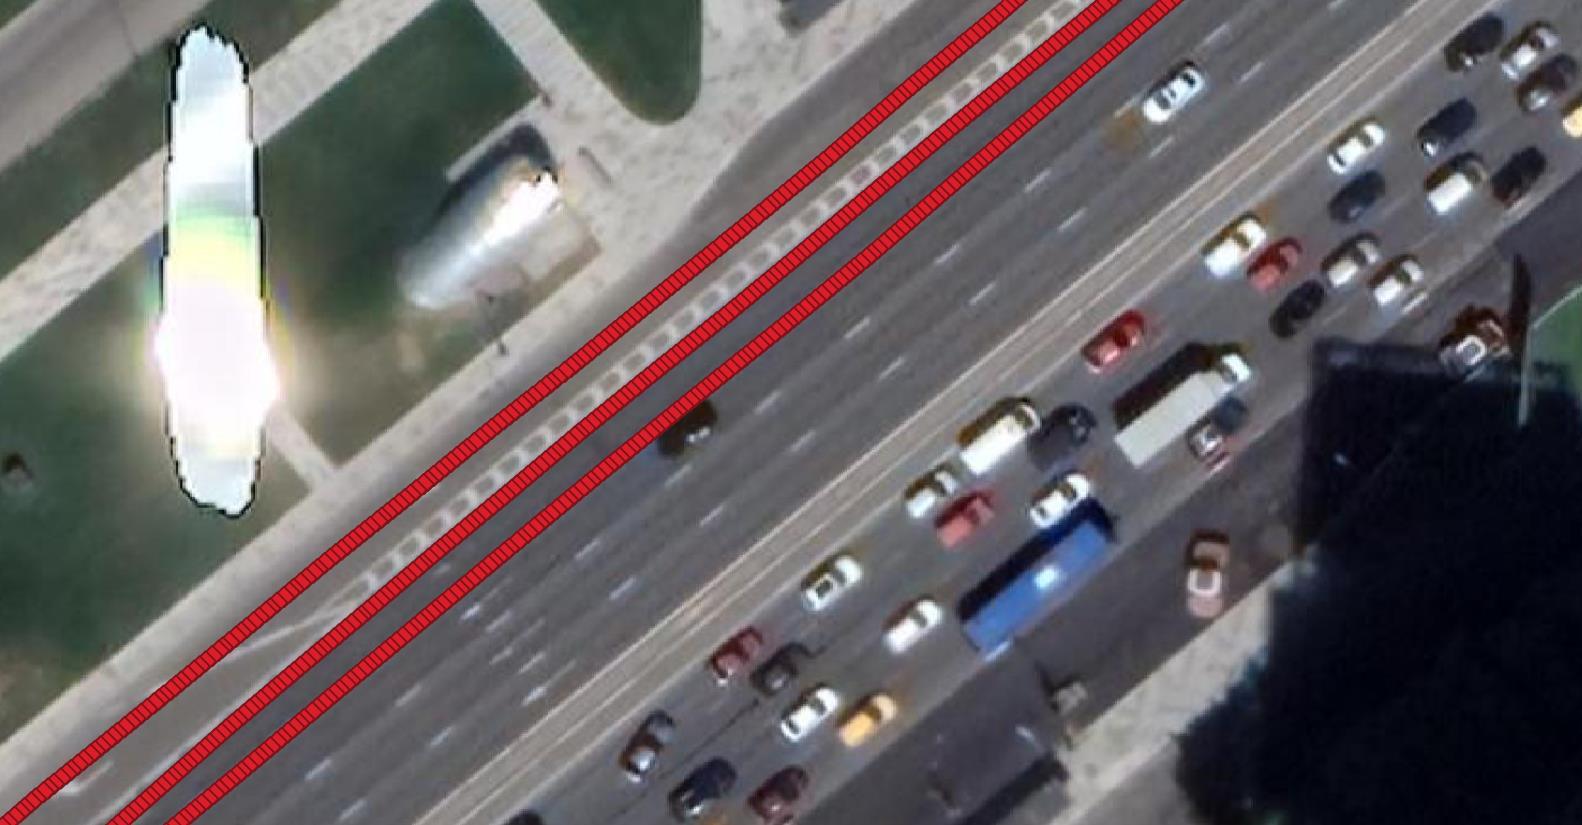
Figure 12 - The trajectory of the OKO GPR (700 MHz). The red lines show the passages with GPR on the first three traffic lanes
Drives along several traffic lanes made it possible to build horizontal GPR slices - amplitude maps (change in the amplitude of the reflected signal over the area for a given depth). Amplitude maps provide the ability to study the underground environment from above, while the cutting plane can be lowered or raised to various depths relative to the scanning surface (pavement surface). Based on the results of the analysis of the pattern on amplitude maps and its comparison with the pattern of individual vertical sections (GPR profiles), the locations of weakened zones in road structures in plan and in depth were determined, which can lead to pavement deformation
The OKO-3 ground penetrating radar survey made it possible to formulate the main criteria for searching for weakened areas of the road structure, as well as to clarify the methodology for detailed work with GRT series ground penetrating radars to quickly cover the entire width of the carriageway
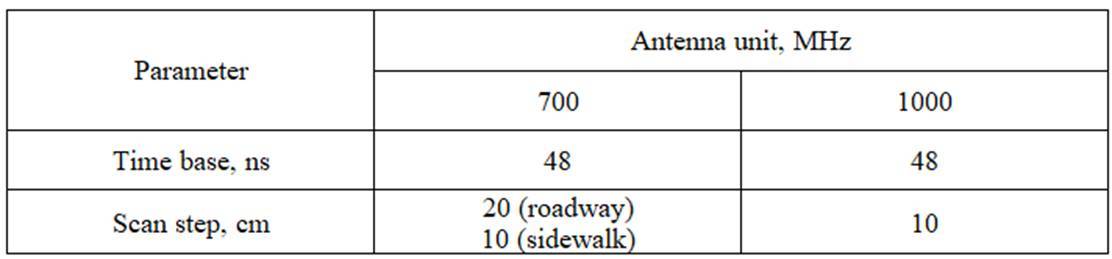
The survey parameters of the OKO-3 GPR are presented in Table 2
Table 2 - Parameters of shooting by OKO-3 GPR
About the equipment. During the survey, the GRT GPR (manufactured by NPO TerraZond) used non-contact antenna units with a linearly modulated frequency in the ranges of 200-1200 MHz (GRT-1, Figure 10 on the right) and 500-3000 MHz (GRT-3, Figure 10 on the left). GPR trajectories were also recorded in the georeferencing file using satellite equipment
Drives with GRT GPR were made on each lane. During the survey, GRT1 data made it possible to analyze the road structure to a scanning depth of up to about 1.5 m, and GRT-3 - asphalt concrete layers
A feature of GRT GPR operation is the ability to obtain a series of exactly parallel vertical electromagnetic sections (GPR profiles) over the entire width of the antenna array (approximately from 2 to 4 m) with a transverse step between profiles from 7.5 to 15 cm (depending on the type antenna array)
Carrying out passages on each after the movement, the GPR survey covered the vast majority of the pavement area of the surveyed area (Figure 13)
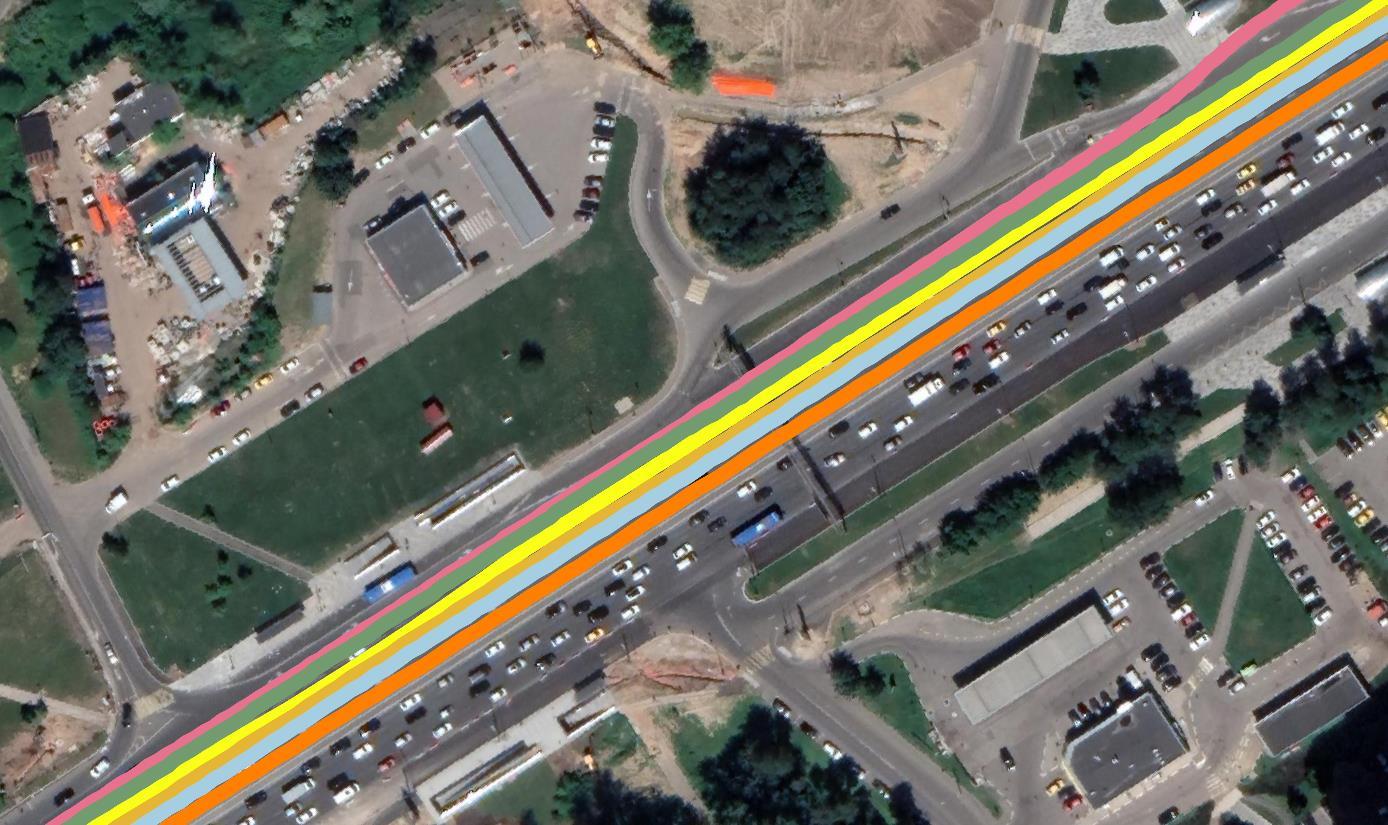
Figure 13 - Survey area of the GRT-3 GPR in width (500-2500 MHz). Passages with GPR are displayed in different colors for each lane
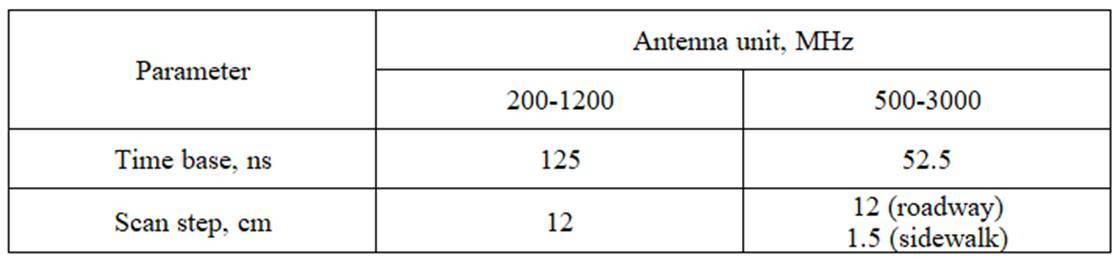
Amplitude maps were also built based on the results of GRT series GPR passages. Equipment survey parameters are presented in Table 3
Table 3 - Survey parameters of GRT series GPR
Cameral processing was performed in GeoReader software. Visualization of the GPR survey results was carried out in the QGIS software package (open source software). It should be noted that the GeoReader software package is the only multi-format russian software that allows you to work with large amounts of GPR data obtained during the survey of roads and other extended linear objects
The data processing technique is represented by the indicated operations:
1. Analysis of raw materials
2. Formation of GPR projects, which included a set of GPR profiles recorded on the site
3. Import of planned coordinates of GPR passage points
4. Interpretation of GPR profiles:
a) drawing boundaries and determining the relative thickness of the pavement layers (without calibration based on drilling results)
b) attribute analysis and analysis of the uniformity of properties of pavement layers
c) search for areas of heterogeneous properties of materials and soils on GPR profiles
5. Interpretation of amplitude maps:
a) search for heterogeneous areas on amplitude maps
b) comparison of areas of heterogeneous properties of materials and soils on amplitude maps with the results of interpretation of GPR profiles
c) interpretation among areas of heterogeneous properties of materials and soils of weakened zones associated with the possible formation of pavement failures
6. Report preparation
When performing cameral work, the procedures for subtracting the direct passage signal, amplifying and filtering the reflected signal were applied
Based on the results of the reconnaissance passage of the GRT-3 GPR, first of all, data analysis was performed at the site of a known pavement failure on a dedicated lane for public transport (Figure 14)
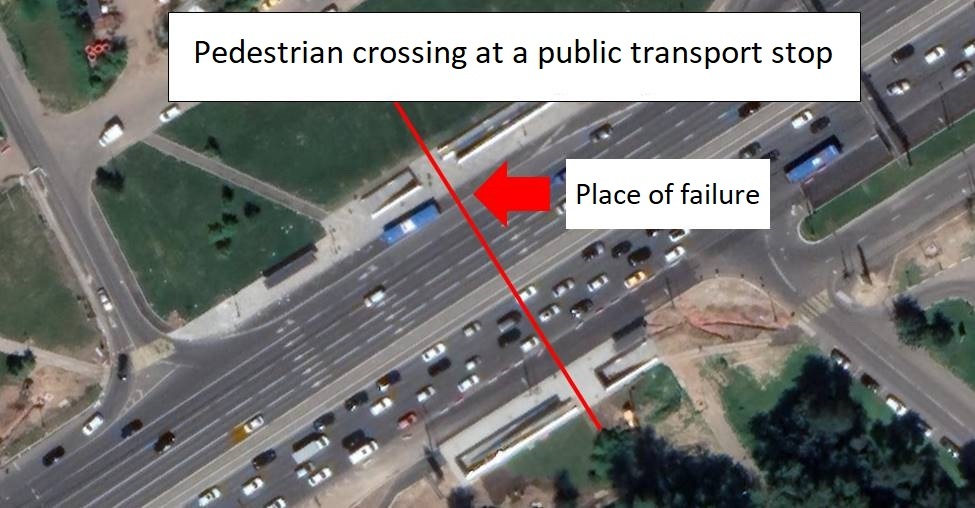
Figure 14 - Place of pavement failure
Figure 15 shows the GPR profile of the GRT-3 GPR with indication of the detected place of pavement failure. On the GPR profile at the site of the failure, there is an approximately twofold increase in the thickness of asphalt concrete (highlighted in red) at the edges of the section indicating the location of the pedestrian underpass (highlighted in green). At the same time, at the facility, the void under the road surface was opened and eliminated by the operating organization of the site. An increase in the capacity of asphalt concrete here may indicate the consequences of repairing the site. Such deviations are quite common for city roads and streets. An increase in the capacity of asphalt concrete is the first sign of a problem area, however, as in the current situation, it may indicate the consequences of a repair, but not necessarily indicate the danger of a new pavement failure. In this regard, it was necessary to re-survey the site with equipment that can provide a greater depth of penetration of the electromagnetic signal in order to assess what signs of weakening are observed in the layers of the base of road structure
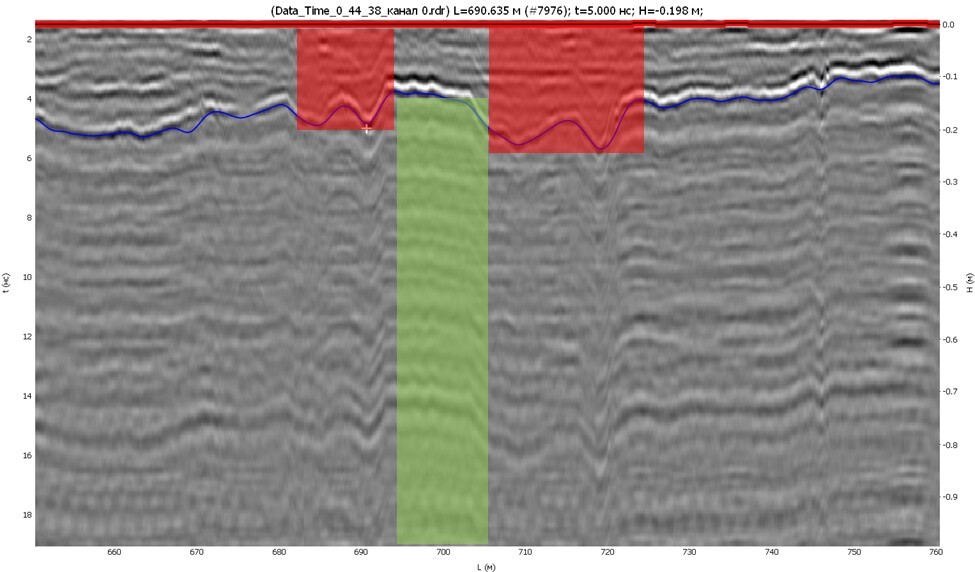
Figure 15 - GRT-3 GPR profile in the place of pavement failure (the first lane)
The data of the OKO-3 GPR with antenna units of 1000 MHz (with separation from the surface) and 700 MHz (contact) were analyzed. The data of the 1000 MHz antenna unit of the OKO-3 GPR (Figure 16) showed a picture identical to the GRT-3 data, but did not provide a better result in terms of scanning depth. The convergence of the survey results obtained by different equipment indicates the high-quality field data of both GPR, the absence of distortion and interference in the data due to the influence of various external factors
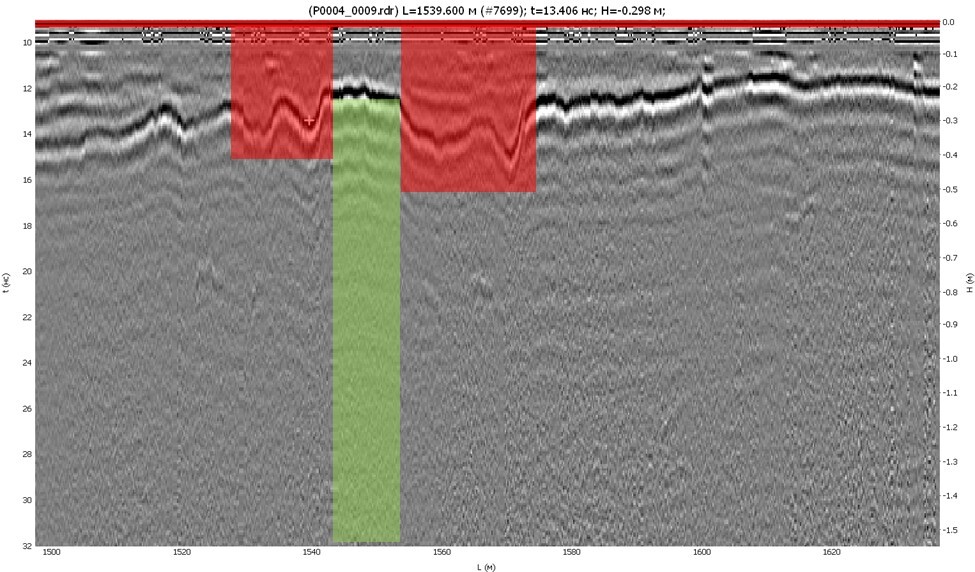
Figure 16 - OKO-3 GPR profile (1000 MHz) at the place of pavement failure (first lane)
At the next stage, the data of the 700 MHz contact antenna were analyzed. The specified antenna provided a significantly greater depth of penetration of the electromagnetic signal. With the dielectric constant parameter equal to 6, the information is viewed up to 1.5 m. The data of the 700 MHz antenna unit also indicate the location of the subsidence of asphalt concrete and the underpass (Figure 17). Attention is drawn to high-amplitude anomalies in the base of the road structure under the places of subsidence of asphalt concrete (highlighted in red). Such signs may indicate inclusions of a material that differs in its properties, including its absence (the formation of an air cavity). It should be noted that problem areas are located on both sides of the section of the underground pedestrian crossing, and this may indicate insufficient soil compaction near its outer walls. The detected high-amplitude anomalies under the places of subsidence of asphalt concrete on the GPR profile were taken as a reference image, with which other similar places of the surveyed object were subsequently compared
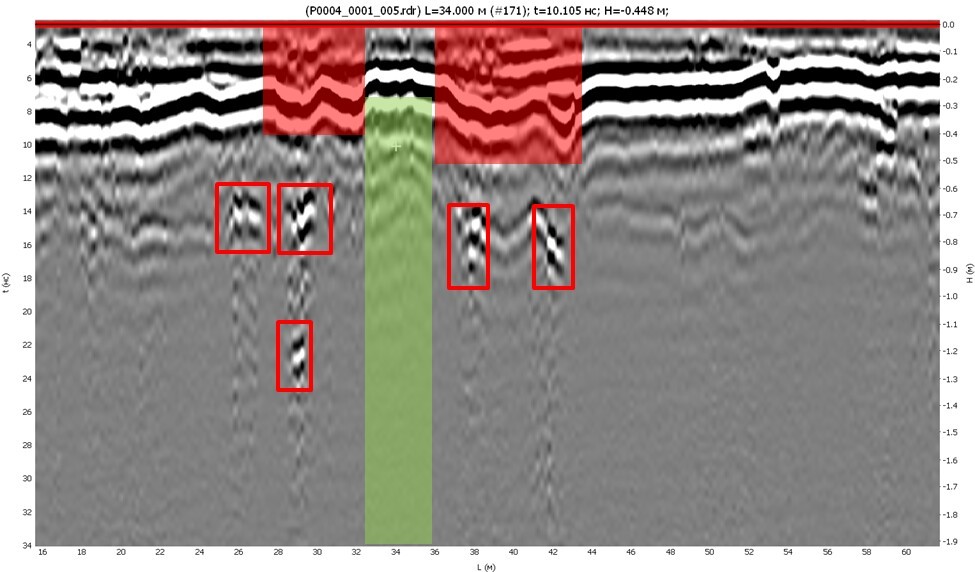
Figure 17 - OKO GPR profile (700 MHz) in the place of pavement failure (first lane)
Based on the surveyed three traffic lanes near the site of the pavement failure, signs of weakened zones can be noted only along the public transport lane before and after crossing the pedestrian underpass
Data from the 700 MHz antenna unit was also analyzed along the entire surveyed area next to another pedestrian underpass. Guided by the same signs (asphalt concrete subsidence and a high-amplitude anomaly at the road structure base), similar places were found
One of these places was found near a nearby pedestrian underpass. Just as in the previous case, subsidence of asphalt concrete is observed on the way to the outer wall of the underground pedestrian crossing section (the boundaries of the section are highlighted in yellow). In addition to subsidence of asphalt concrete, a chaotic wave pattern was also observed at the site of predicted pavement failure (Figure 18, highlighted in blue), so it was decided to perform a more detailed survey of this area. In addition to surveying the carriageway, a section of the sidewalk along the carriageway was also surveyed, crossing the specified pedestrian underpass
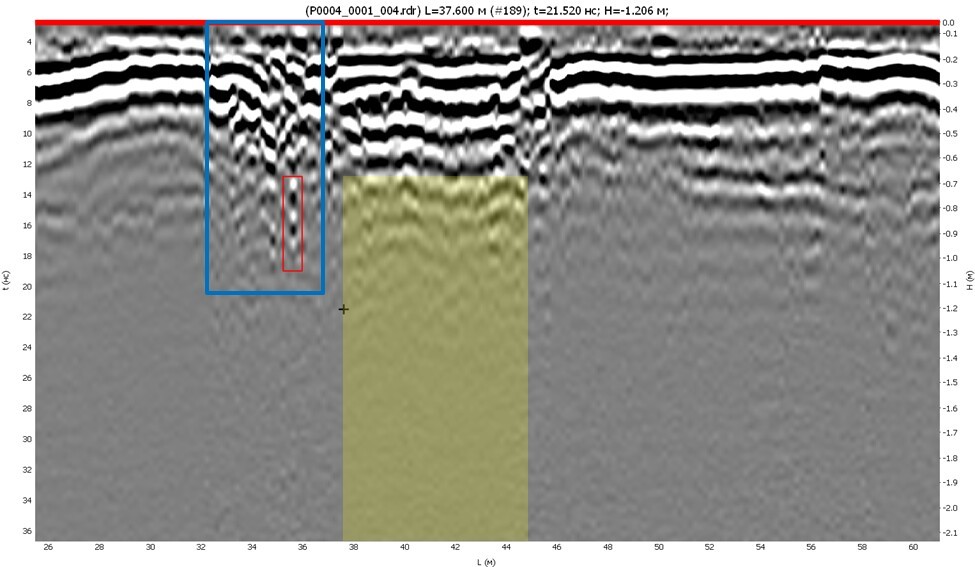
Figure 18 - Potential pavement failure on a dedicated lane for public transport near another pedestrian underpass on the OKO GPR profile (700 MHz)
Along the sidewalk with a step of about half a meter, 3 parallel longitudinal GPR profiles were passed, and one parallel longitudinal profile was also recorded along the sidewalk edges on the roadway and the lawn. Parallel transverse profiles were recorded along the entire section of the pavement with a step of about 1 m between them. The profiles started from the curb adjacent to the carriageway, through the entire width of the sidewalk and capturing part of the adjacent lawn
Figure 19 shows one of the GPR profiles along the sidewalk, the roof and floor of the underpass are clearly visible on it (highlighted in yellow)
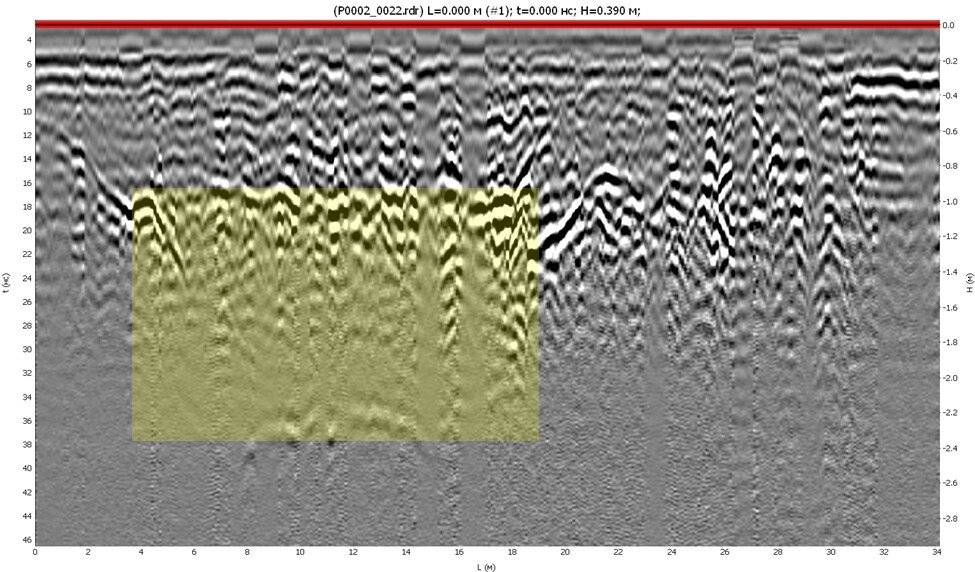
Figure 19 - OKO GPR profile along the sidewalk (700 MHz)
At the same time, no characteristic signs, previously detected by the data analysis results of the 700 MHz OKO-3 GPR antenna unit, are observed on the roadway. In this regard, it was decided to analyze, along with GPR profiles, horizontal slices at different depths (amplitude maps). At the same time, various algorithms of attribute analysis were applied to the initial GPR profiles, among which the attribute - signal energy - turned out to be the most indicative. In addition to horizontal sections along the sidewalk, the same sections obtained from the results of a survey of the carriageway were analyzed simultaneously. Figure 20 shows the result of the simultaneous construction of an amplitude map for a section of the sidewalk and on the roadway. The depth of the amplitude map roughly corresponds to the range from 0.5 to 1 m. In the amplitude map, inhomogeneities are highlighted in green, yellow and red, while purple, blue and black correspond to areas of relatively homogeneous structure of the underground environment. The red frame on the amplitude map shows the location of part of the underground pedestrian crossing section, so the indicated heterogeneity is evidence of a constructive difference in the underground environment. Another place that attracts attention is located at the junction with the pedestrian underpass (highlighted in yellow). It can also be observed on the GPR profile as a drawdown (Figure 18, blue frame). In addition, on the combined amplitude map, part of the specified area falls on the driveways along the carriageway, and part of the shooting along the sidewalk. Specified says that the defects observed at the outer wall of the pedestrian underpass, partially affect the underground environment under the sidewalk
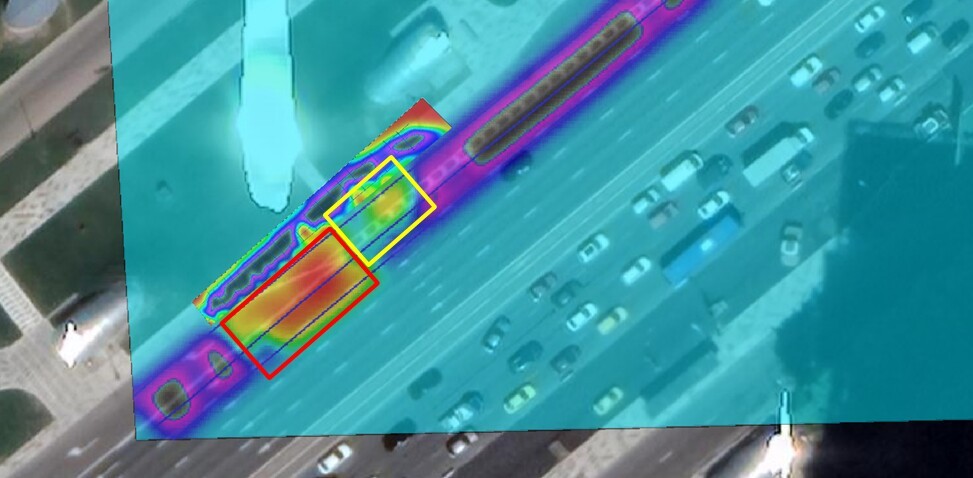
Figure 20 - The result of the simultaneous construction of an amplitude map for a sidewalk section and the roadway
Since the survey by the OKO-3 GPR with a 700 MHz antenna unit was not carried out beyond the 3rd lane, the results of the GPR survey of the traffic lanes from 3rd to 5th were additionally presented. Based on the survey results of using GRT GPR, an analysis was made of the state of road structures over the entire width of the surveyed area. Since the repeatability of data on lanes 1 to 3 obtained by OKO-3 GPR and GRT (1, 3) was confirmed in the current survey, the survey results of lanes 3 to 5 were based only on GRT-1 and GRT-3 GPR data. When collecting data with the GRT-1 GPR, 7 exactly parallel profiles were recorded for each traffic lane, and when collecting data with the GRT-3 GPR, 14 of the same profiles were recorded. GRT-3 data were used to determine asphalt concrete settlements, and GRT-1 data were used to search for high-amplitude anomalies in the base of the road structure
As previously indicated, signs of the presence of weakened zones that can lead to pavement failures are the subsidence of the asphalt concrete sole on the GPR profile and the high-amplitude anomalies accompanying these subsidences at the road structure base. Due to the huge amount of data and the inefficiency of the individual GPR profiles analysis, it was decided to analyze the amplitude maps and the map of thickness changes of asphalt concrete in plan
The search for asphalt concrete boundaries was performed in a semi-automatic way, in which the operator specifies the starting point of the search, and then the algorithm performs tracking along the selected signal phase. Each passage GRT-3 contains 14 exactly parallel profiles, the operator draws only the first of them, the remaining profiles are marked automatically
Figure 21 shows a map of thickness changes of asphalt concrete over the surveyed area entire width
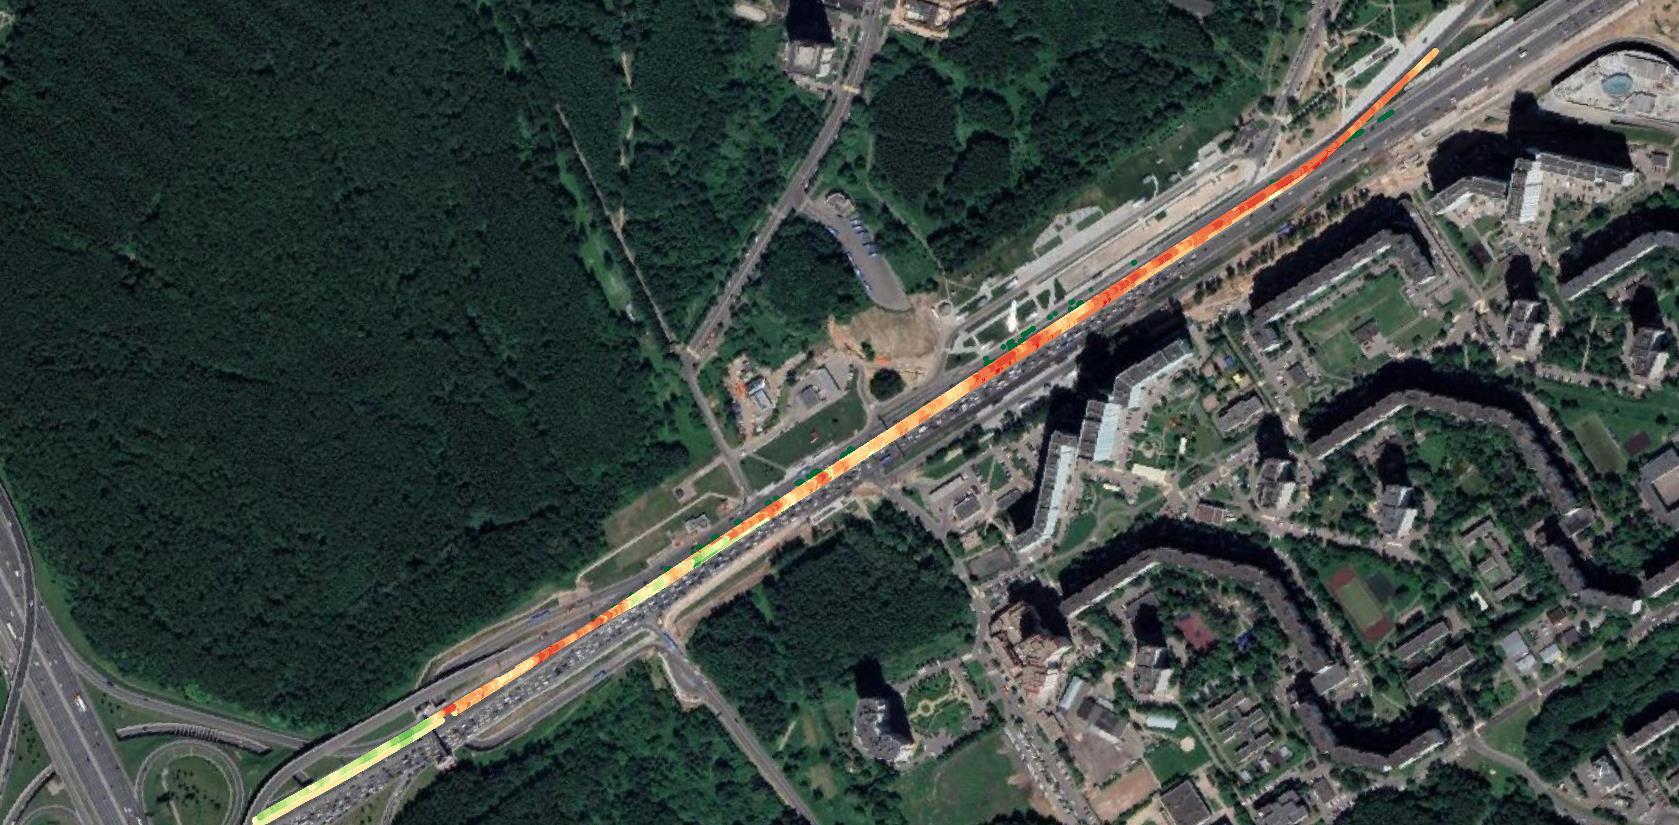
Figure 21 - Map of the thickness changes of asphalt concrete (data from the GRT-3 GPR)
The relative thickness of asphalt concrete varies from 6 cm to 45 cm. The minimum thickness corresponds to red, the maximum to green. The search criterion for asphalt concrete settlements on the map was a relative thickness of more than 30 cm in a radius of about 5 m. Areas corresponding to a relative thickness of less than 30 cm were filtered and hidden for display. At the same time, amplitude maps were added in a separate layer in the relative depth range from 0.5 m to 1 m with a step between horizontal slices of about 5 cm. On the amplitude maps, areas of low amplitudes were filtered in a similar way and positive amplitudes of more than 7 (close to the maximum for the whole object). The places where the following criteria are observed simultaneously were interpreted as weakened: the relative thickness of asphalt concrete is more than 30 cm, the positive amplitude of the reflected signal is more than 7, the area diameter is not more than 10 m. Based on the analysis, one place was found for which all the criteria converged
Figure 22 shows a fragment of the GPR profile at the site of the predicted pavement failure. It can be seen from the figure that the weakened zone (highlighted in orange) is confined to an underground structure (probably a utility line). On the GPR profile, subsidence of the asphalt concrete boundary and a high-amplitude anomaly at the base of the pavement are observed
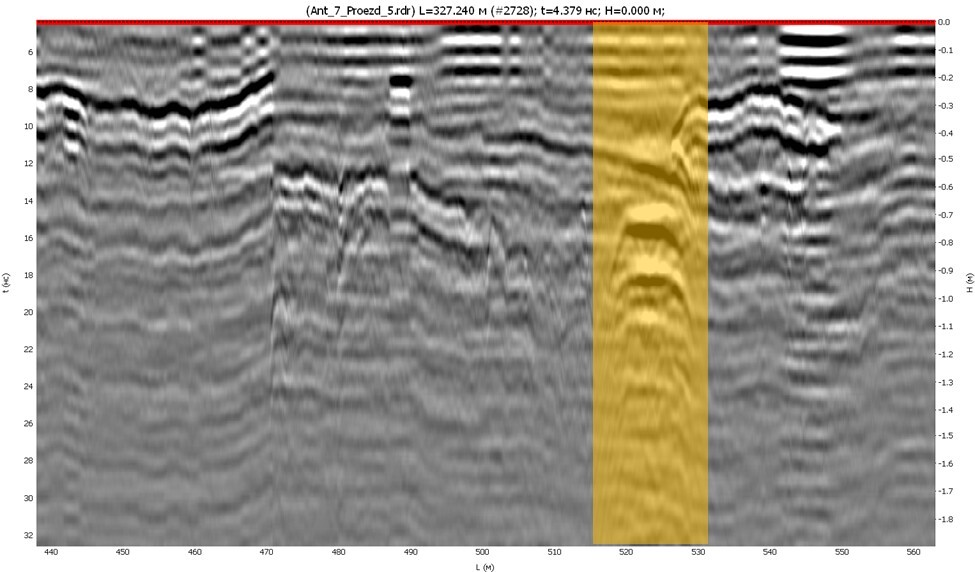
Figure 22 - Potential location of the pavement failure on the 5-1 lane of Leninsky Prospekt (GRT1 GPR)
Based on the GPR survey results, the location was determined and signs of deformation of the road surface were identified on GPR data based on the analysis results of a previously known failure pavement point of the underground pedestrian crossing near the public transport stop, and the places of possible road surface deformations in other places were predicted with the reasons explanation
According to the results of non-destructive survey, the reasons for the formed and predicted pavement failures on a dedicated lane for public transport near pedestrian underpasses are structural heterogeneities under the asphalt concrete pavement, most likely associated with insufficient soil compaction at the outer walls contact the underpass run with the road structure base
The reason for the predicted failure on the fifth lane of the surveyed object is associated with the underground structure negative impact (engineering communication), which can be explained by the soil decompaction above the communication
Thank you for your attention!
Recommendations for a GPR survey performing and work methods are described in more detail on the page "Normative and technical support of GPR works"