


Article. Spatial analysis of GPR data
UDC 625.8:550.8.053. Collection // ROADS AND BRIDGES / 49-1/2023. P. 145-157
R.A. Eremin, A.M. N.G. Pudova (FAI "ROSDORNII"), D.B. Romanov (NPO Terrazond)
The article contains information about the possibilities of using spatial analysis by means of GIS applications to evaluate the results of a GPR survey. Separate GPR profiles contain useful information about the internal structure and condition of pavement structures in certain sections of the road. At the same time, in order to effectively search for weakened zones of road structures and explain their causes, it is also necessary to analyze the relief, situation, and hydrogeological features of the area. Spatial analysis allows you to combine different models of the existing reality in one software window. For example, to see the connection between the places of subsidence of pavement layers, the formation of voids or decompression in the layers of the base of the pavement with the location of underground structures (utilities, underpasses, etc.). The article contains a description of the methodology of spatial analysis and the results obtained on the example of a GPR survey of roads in Moscow
Keywords: ground penetrating radar, laser scanning, road, attribute analysis, weakened zone, pavement
.
According to data science, spatial analysis is the product of computational operations on geodata in order to extract additional information from them [1]. The tools used depend on the application. Professionals involved in the field of water management and hydrology may be interested in terrain analysis to model surface water runoff or the geological structure of an area to model groundwater flows. Ecologists use analytical functions to help identify relationships between wilderness areas and developed areas. Each user himself determines the tools used, depending on what problems he needs to solve. We can also speak with confidence about the possibility of spatial analysis of GPR data, incl. road surveys
The relevance of the problem lies in the fact that the analysis of GPR data is often carried out in an isolated software environment without access to external data sources: a relief model, a situation model, a geological and hydrological model. Analysis of individual vertical and horizontal GPR sections without taking into account the above features of the territory leads to an underestimation of important factors in data interpretation. The possibility of embedding a subsurface geophysical model in a software environment that already contains data on the relief, situation, geology and hydrology helps to increase the efficiency of GPR survey results
Now days, GPR data is recorded using multi-channel and multi-frequency equipment, and data binding is performed by satellite systems. This makes it possible to form arrays of spatial data based on the results of a GPR survey, which can be analyzed in three dimensions. When examining roads, spatial analysis of GPR data primarily makes it possible to detect structural changes in road pavement in plan, longitudinal and cross sections on large areas and linear objects of great length. Evaluate the spatial variability of the uniformity of the properties of pavement materials and subgrade soils, localize the zones of influence of hazardous processes and phenomena. Reliably determine the weakened zones of pavement and subgrade soils of highways in combination with geodetic survey, other non-destructive and destructive methods based on the results of spatial analysis of GPR data, digital or information models of the subsurface environment of highways can be obtained
As part of the current work, examples of the practical application of spatial analysis of GPR data in order to determine the weakened zones under the pavement of urban roads, leading to its deformations, are demonstrated
The purpose of the study is to increase the efficiency of localization of weakened areas of pavement and subgrade of roads based on the results of GPR surveys
Research objectives:
1) Describe the methodology for converting initial GPR profiles into an array of spatial data
2) Perform a spatial analysis of GPR data, incl. together with other types of spatial information
3) Demonstrate the possibility of detecting weakened zones at the base of the road based on the results of spatial analysis
4) Evaluate the possibility of predicting pavement deformations based on the results of spatial analysis
Methodology of implementation and analysis of the results of the study
The studies were carried out on the example of GPR data obtained by means of areal foot surveys with a GPR of the OKO series (Ramenskoye, Moscow region), as well as surveys using a car with a multichannel GPR of the GRT series (Moscow). In both cases GPR surveys were carried out on the roads of Moscow
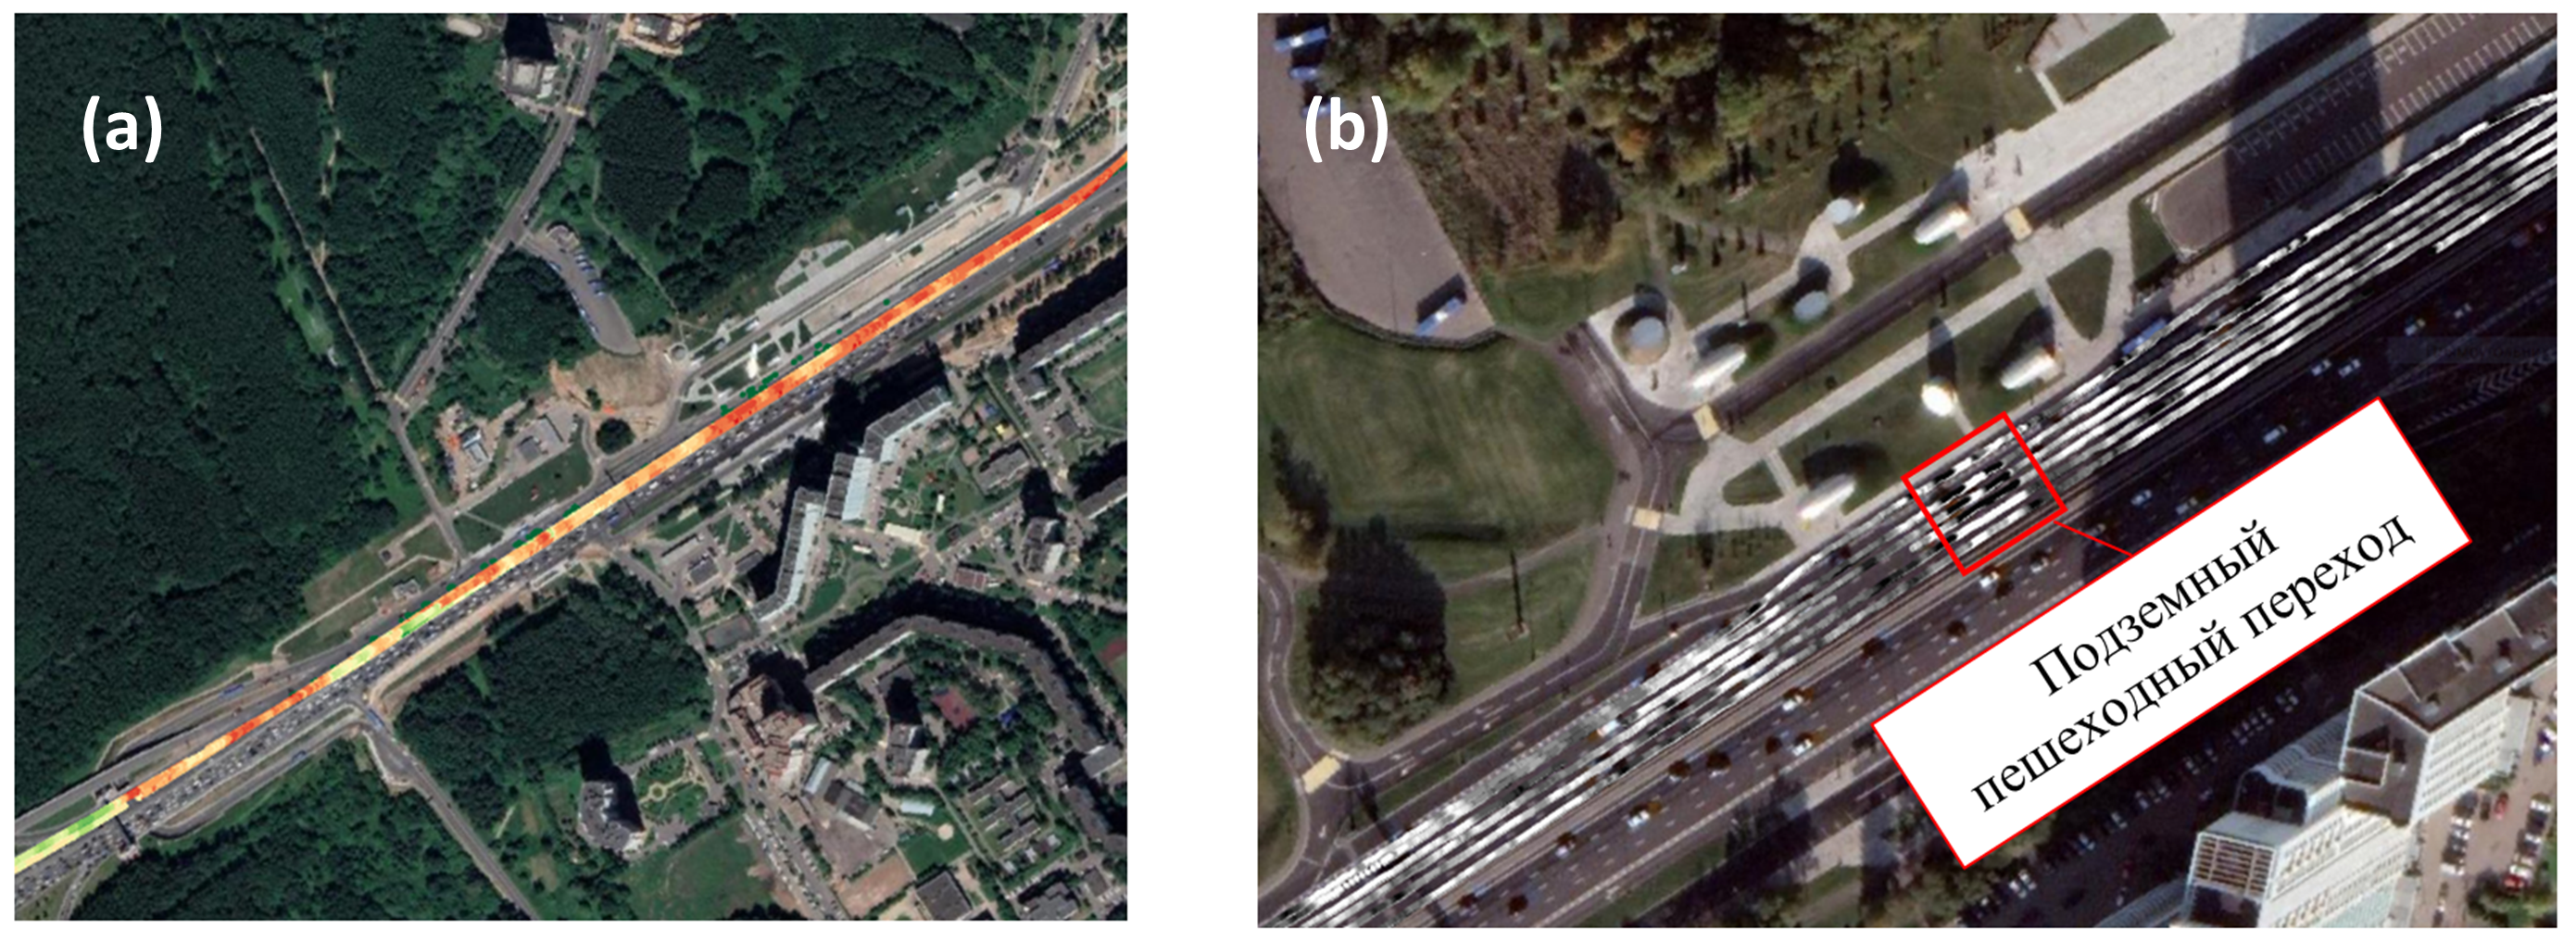
In the first case, the survey was carried out near the site of repeated failure of the pavement. On a section of a three-lane city street, a survey was made by a mobile laser scanning system, the location of the pavement defect in the point cloud is shown in Fig. 1
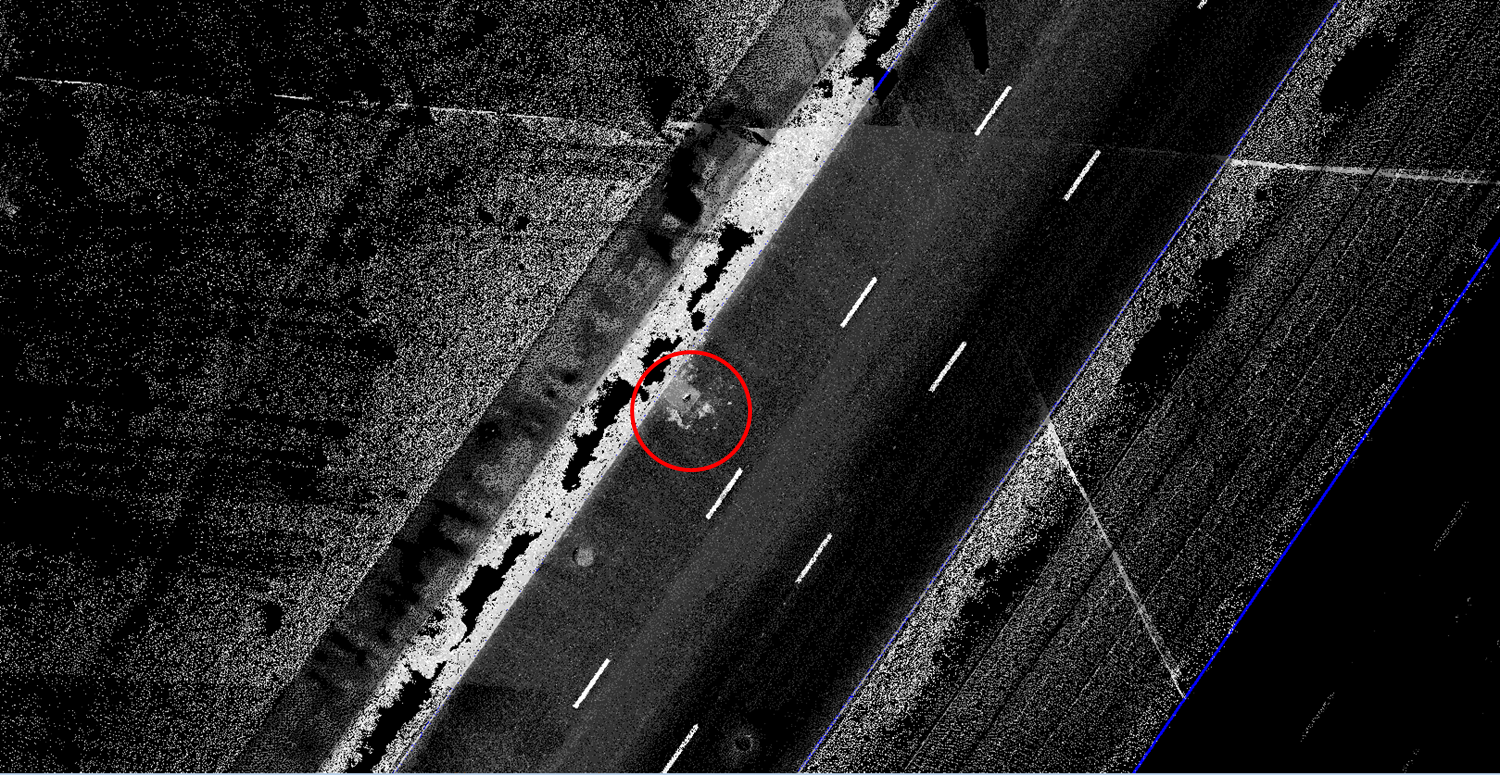
Figure 1 - The location of the failure of the pavement in the point cloud of laser scanning (highlighted with a red marker)
Pedestrian GPR scanning of the carriageway was carried out by GPR of the Oko series with a central frequency of 700 MHz by a series of 4 longitudinal and 4 transverse GPR profiles. The distance between the longitudinal profiles was on average 1.7 m, and between the transverse profiles, on average 1.0 m. When performing a GPR survey, it was supposed to reveal signs of an air cavity in the place of a failure of the road surface [2], in connection with which the procedure of attribute analysis was applied to all GPR profiles to calculate the maximum amplitude of the reflection of an electromagnetic signal.

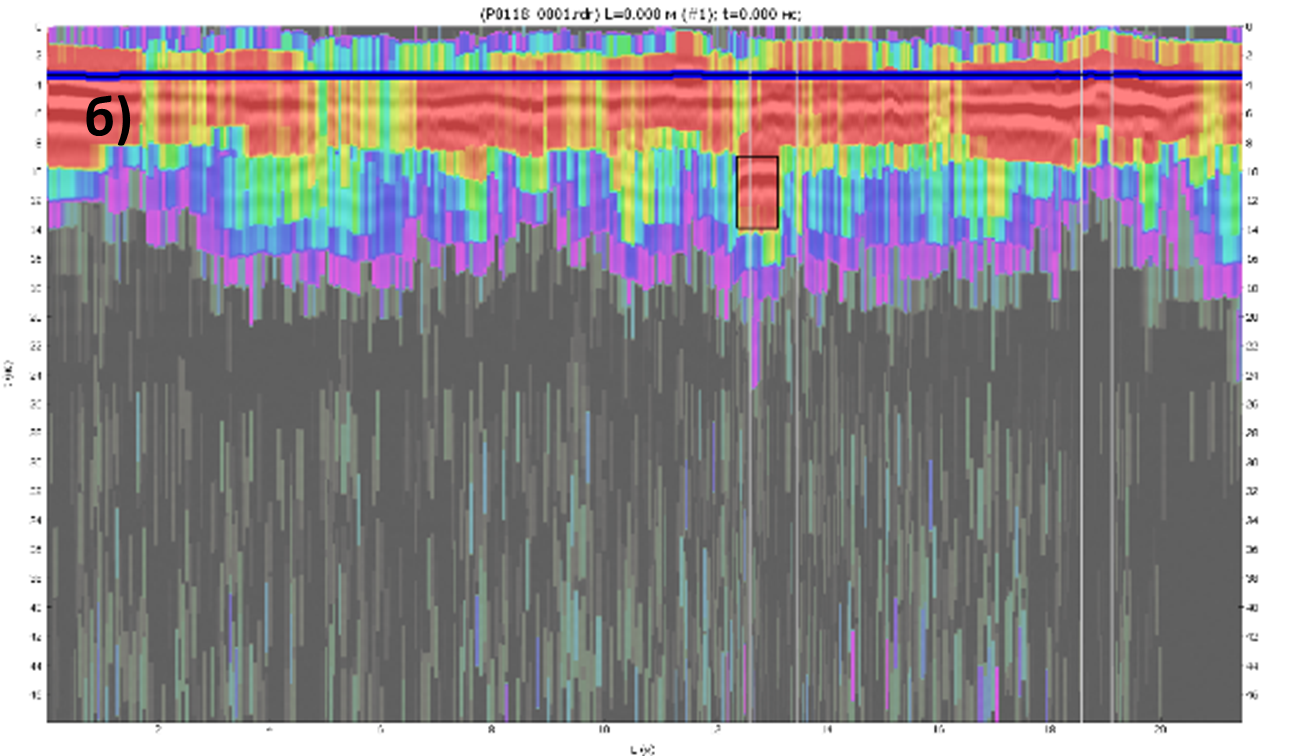
a) cross profile, vertical white lines are carriageway`s lane boundaries; black rectangular marker - a sign of a weakened zone (air cavity)
б) longitudinal profile, vertical white lines - the place of failure of the road surface and the hatch of the manhole, respectively; black rectangular marker - a sign of a weakened zone (air cavity)
Figure 2 - Calculation of the "Maximum amplitude" attribute (red color corresponds to the highest amplitude values)
Examples of converted GPR profiles are shown in fig. 2. Figure 2 shows the detection of several places with signs of a weakened zone (air cavity). At the same time, distinct signs do not provide visual information about the shape of the weakened zones in plan of the road, what spatial distribution they have. In order to answer these questions, interpolation of data in the space between GPR profiles, which is often used in this case, was performed. The results of this procedure are the construction of amplitude maps or C-Scan in international terminology. Amplitude maps were built over the entire time section with a step of horizontal slices of 3 ns; for comparison, 4 slices in the range from 6 to 18 ns are shown in the work (Fig. 3). A significant difference from traditional amplitude maps was their presentation not in the form of amplitudes and frequencies of the original signal, but in the form of an attribute analysis result (“Maximum amplitude in a sliding window”). As can be seen from fig. 3 detected attenuated zones (air cavities) change their shape and size at different depths, having the greatest distribution and signal reflection intensity at a depth corresponding to 9–12 ns (Fig. 3b). In this case, they only begin to be observed in the range of 6–9 ns (Fig. 3a), decrease or disappear in the range of 12–18 ns (Fig. 3c and 3d)
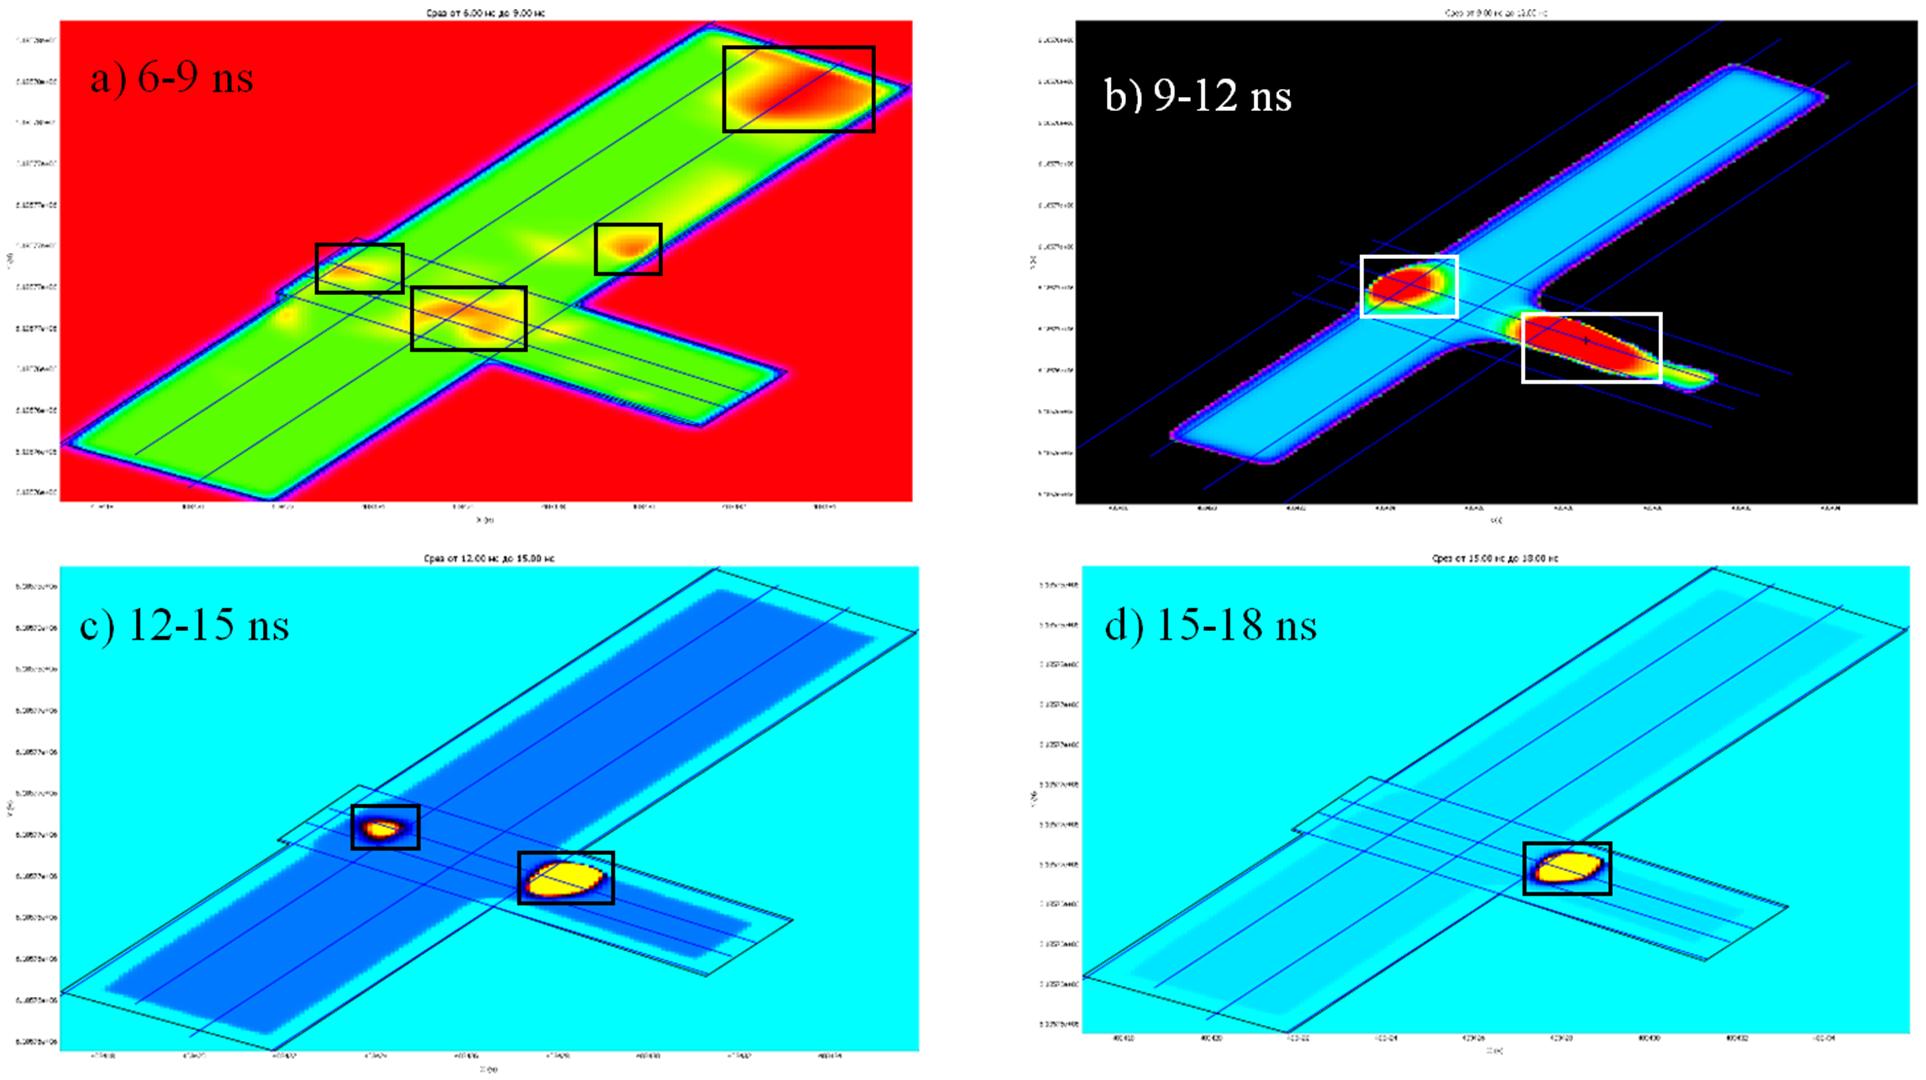
Figure 3 - The result of building an amplitude map according to the attribute "Maximum amplitude in the sliding window" (rectangles highlight the places with the highest amplitude values)
Shown in Fig. 3, the result was converted into a georeferenced raster image of the GeoTIFF format and combined with the laser scanning point cloud (Fig. 4). Figure 4 shows that one of the weakened zones (air cavity) is in close proximity to the failure of the pavement, while the second weakened zone does not manifest itself in any way on the surface

Figure 4 - Alignment of the amplitude map with the point cloud of laser scanning red-rectangular areas are weakened; blue - utility
A detailed examination of the transverse GPR profile (Fig. 5) in the place of the identified weakened zones allows us to conclude that the wave pattern is characterized by the characteristic features of an air cavity: an increase in the intensity of the reflected signal and a change in the phase of the signal. A reflection from utilities was found on the transverse GPR profile. The subsidence of the reflecting boundary on the right above the communication indicates its direct relation to the development of an air cavity under the middle lane of the road section
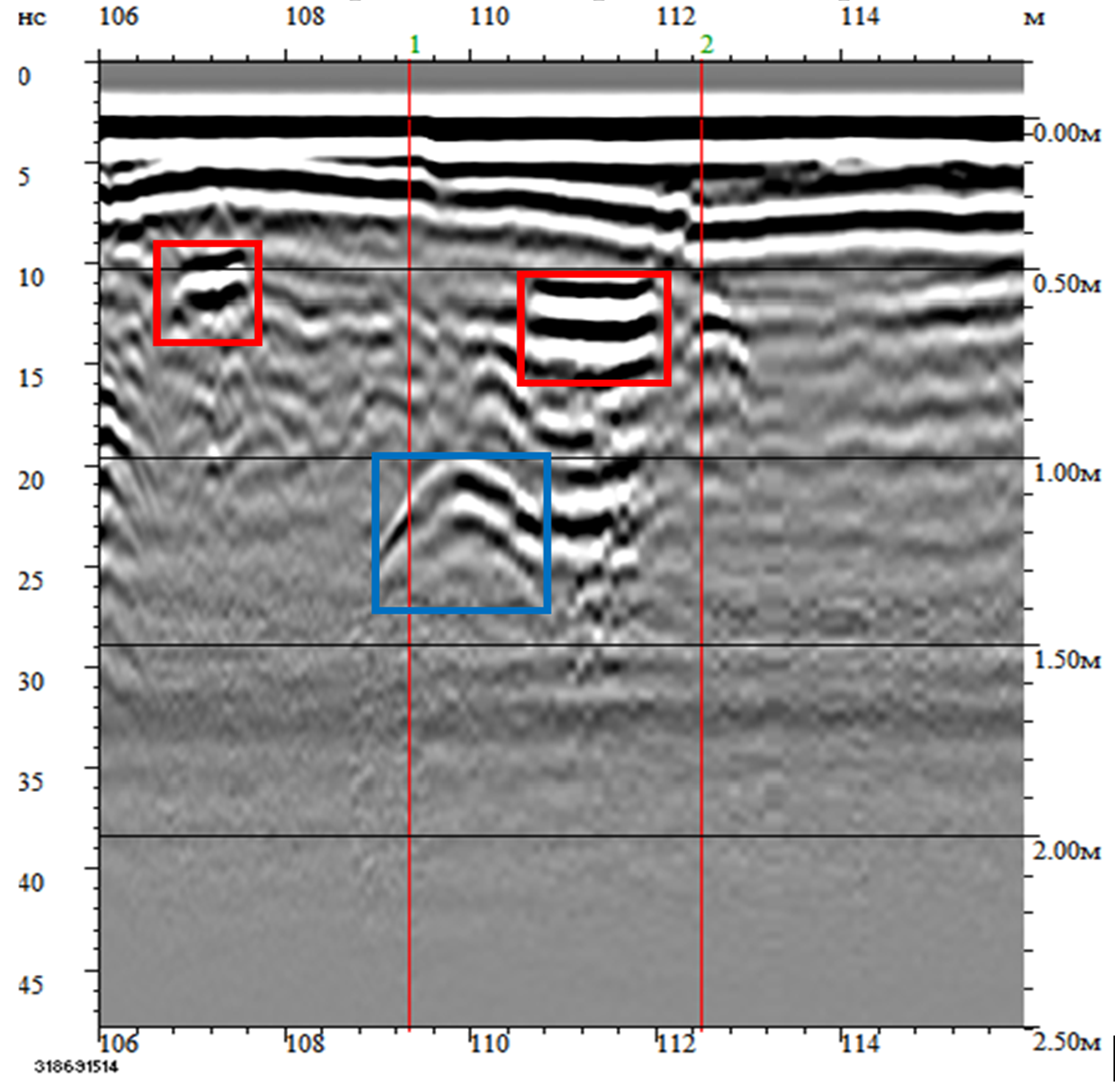
Figure 5 - Transverse GPR profile at the location of the identified weakened zones: weakened zones are marked with red rectangles; blue - drawdown associated with the engineering facility (marked with a dot)
Also, spatial analysis made it possible to quantify the attributes of the signal in attenuated zones (air cavities). Amplitude maps in the form of a vector layer with attributes were loaded into the GIS application, after which the attribute “Maximum amplitude in a sliding window” was classified into 7 ranges of values (Fig. 6). Figure 6 shows that the characteristic maximum amplitude values in the time range of 9–12 ns do not exceed 240 units, while in places where weakened zones form, they exceed 340 units
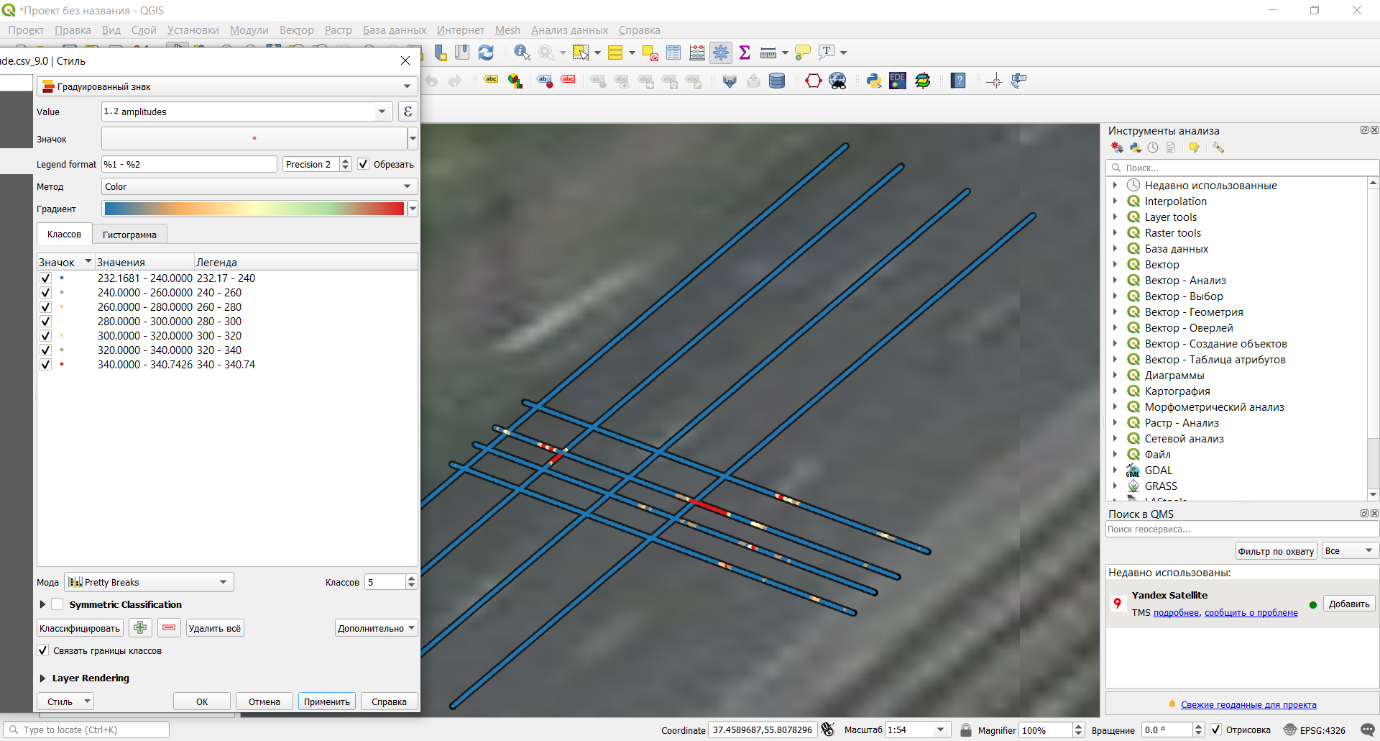
Figure 6 - Quantification of signal attributes in attenuated areas
Based on the results of the survey, a high probability of failure of the road surface along the middle lane at the place of formation of a weakened zone associated with the influence of utility was predicted
Another section of the road was a 5-lane main street along which the exit from Moscow to the highway is carried out. Due to the high traffic intensity, all GPR works on the roadway was carried out with the help of a car. The work was carried out by a multichannel GPR of the GRT1 and GRT3 series with antenna units operating in the frequency range of 200-1200 MHz and 500-2500 MHz, respectively. Drives were made along each lane, the useful survey width of each driveway was just over 1m for GRT1 and just over 1.5m for GRT3. GPR series "OKO" was used to verify the reliability of the results of GPR series GRT [3], because experience with the latter is relatively small. As part of the study, it was necessary to establish the places of potential failure of the pavement, because on one of the sections of the surveyed road, the indicated deformations had previously occurred. Based on preliminary studies of the location of the confirmed violation of the road surface, the signs of a potential failure were: subsidence of the asphalt layer of pavement on the GPR profile and an area of increased amplitude of the reflected signal under the indicated subsidence in the layers of the base of the pavement structure (Fig. 7). These signs have been observed more than once by other researchers [4] - [6], and therefore the conclusions about the causes of the formation of defects in the pavement, obtained in the framework of spatial analysis, are objective, taking into account existing practice
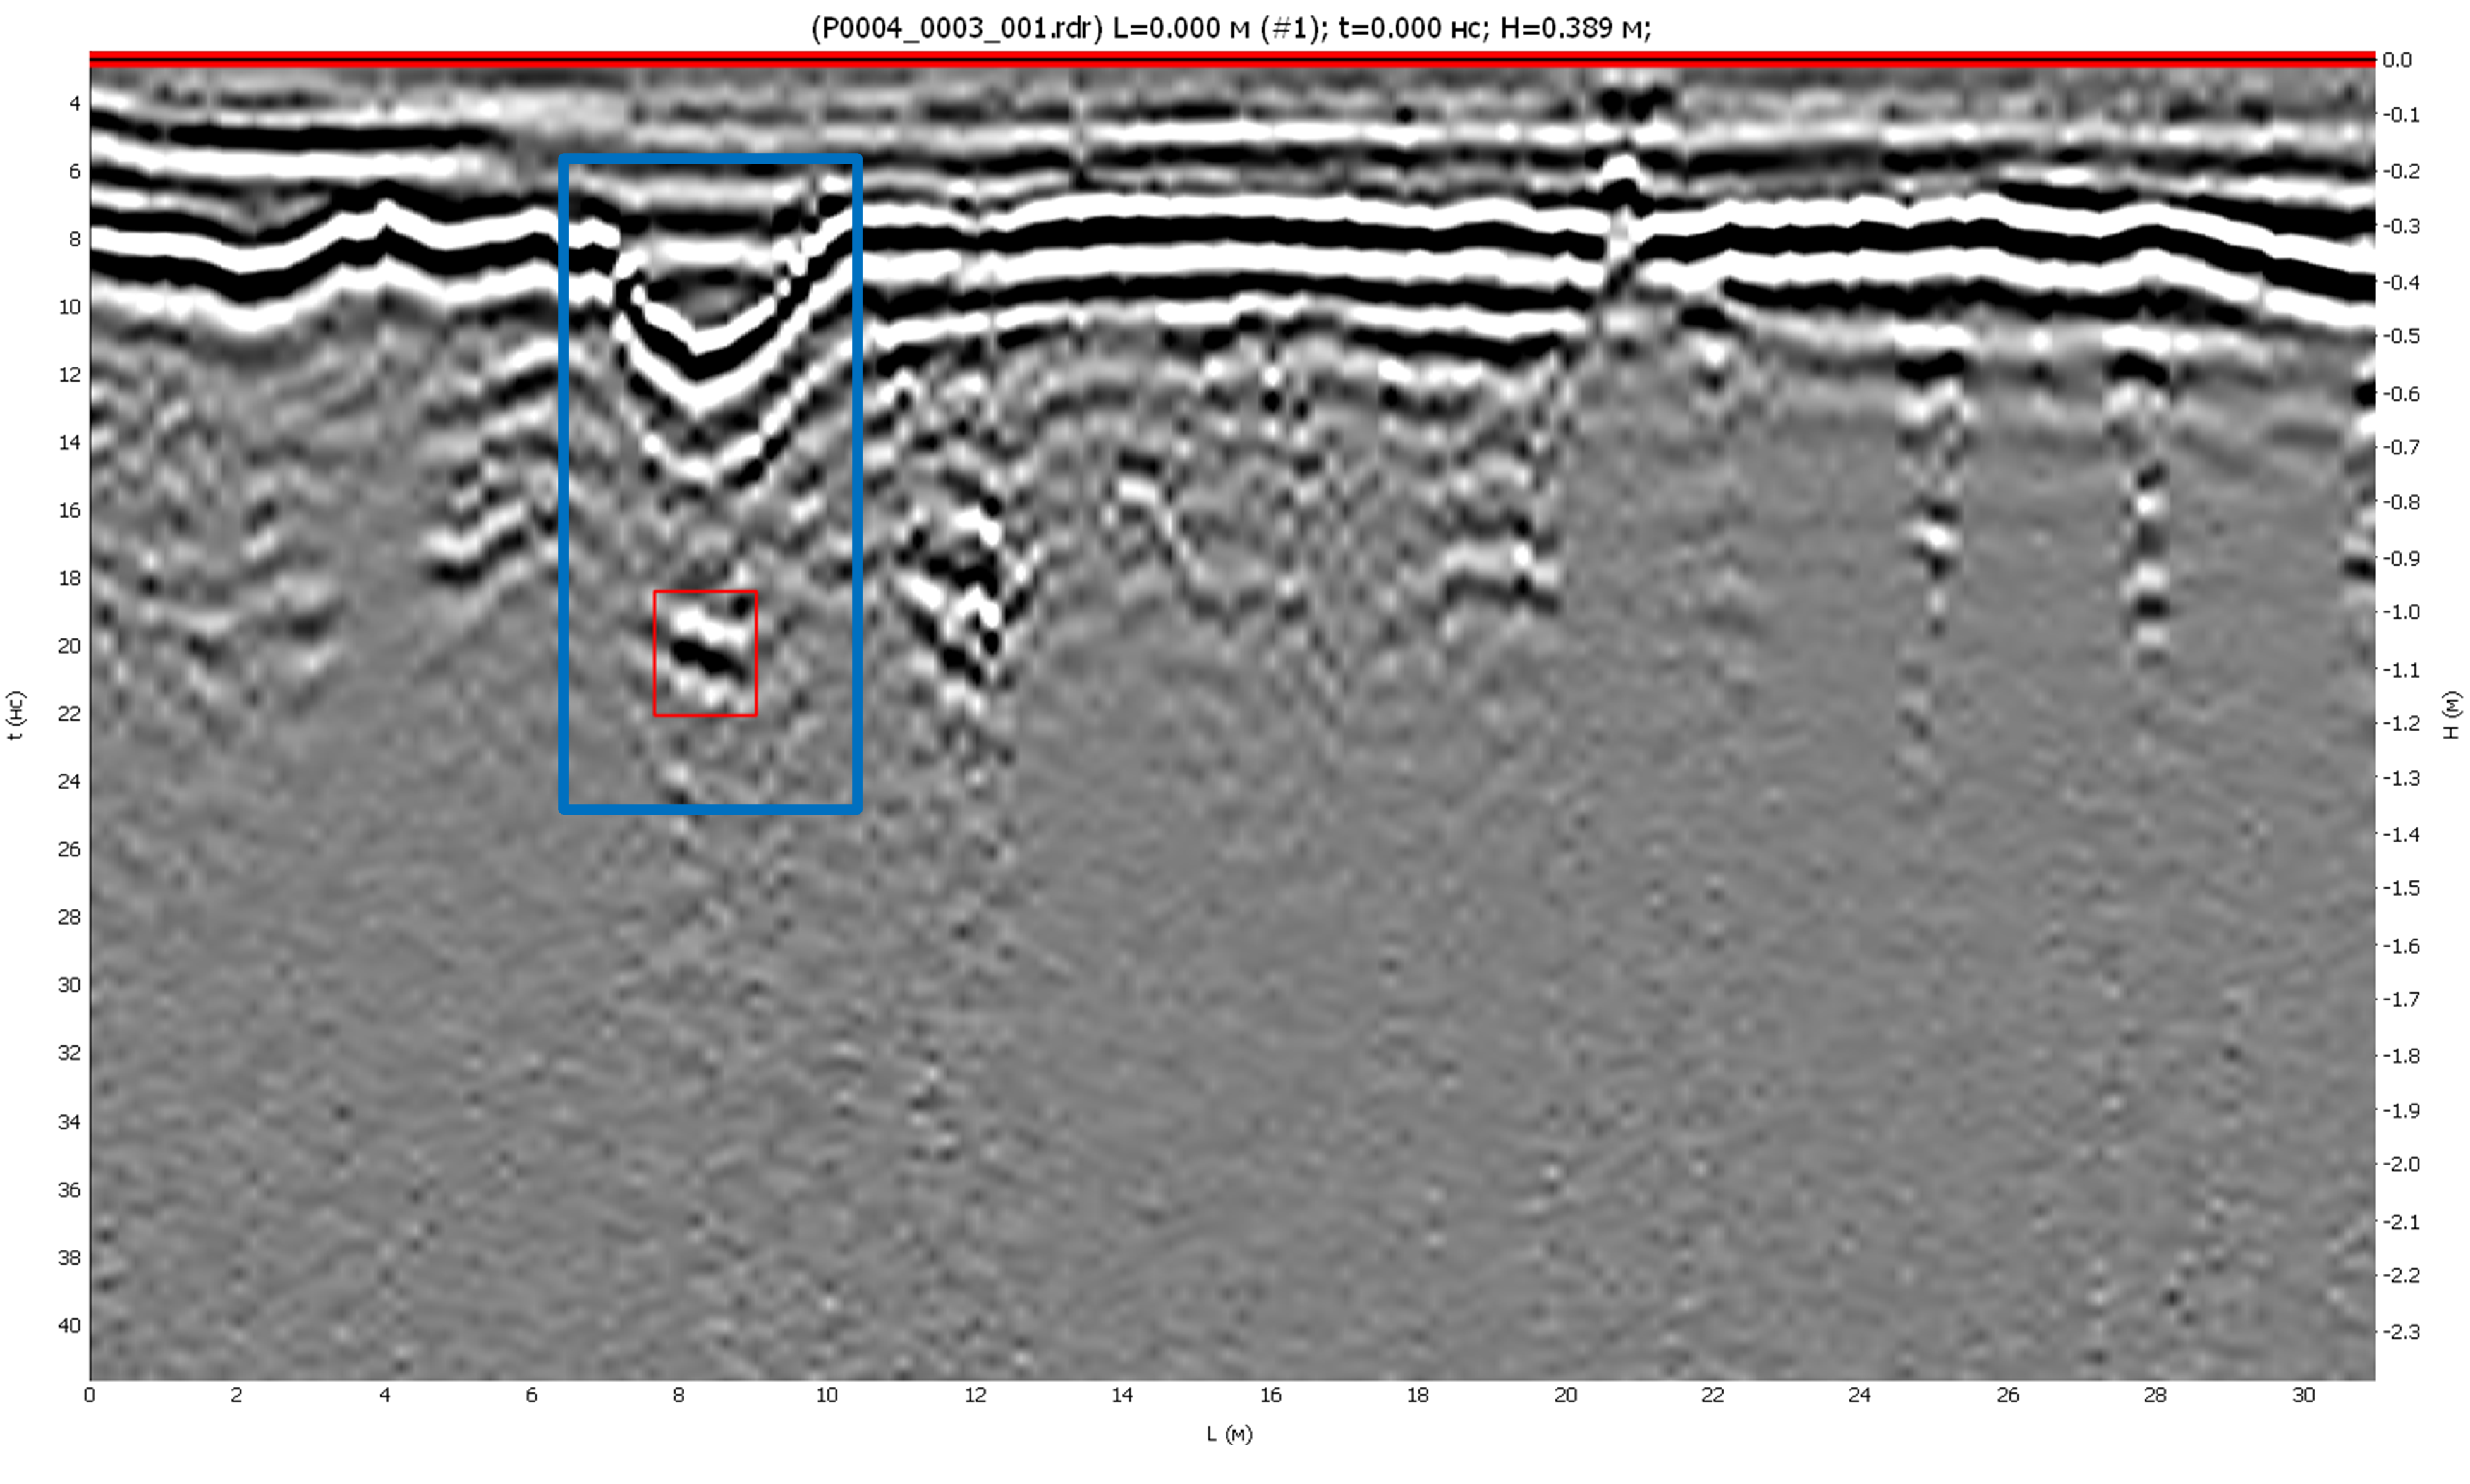
Figure 7 - GPR profile 700 MHz ("OKO series "GPR) with prerequisites for the failure of the road surface (blue - the area of subsidence of the asphalt layer, red - the zone of high signal amplitudes under the subsidence)
Spatial analysis was performed in a GIS application. Vector GIS layers with the results of GPR survey were loaded onto the cartographic substrate (Fig. 8): maps of asphalt concrete thickness change (according to GRT3 data) and reflected signal amplitude (according to GRT1 data) at the desired depth (10-15 ns on the time scale). In the GIS application, spatial data was filtered for each of the layers with certain criteria: the relative thickness of asphalt concrete is more than 30 cm within a radius of 5 m for the GRT3 data and positive amplitudes of more than 7 conventional units (close to the maximum for the entire object at a given depth) for the GRT1 data . According to the spatial relationship of the data remaining after filtering on the map, the places where both criteria coincided were found. These places were analyzed on GPR profiles, after which areas of potential pavement failure were predicted. A high probability of deformation of the pavement layers at the intersection of the highway with an underground pedestrian crossing and utility is predicted [3]
a) Asphalt concrete thickness change map (GRT3); b) Map of signal amplitude changes in the range of 10-15 ns (GRT1)
Figure 8 - GIS layers with GPR survey results
.
Conclusions
1) Modern methods and tools for surveying roads are characterized by the need to collect and process large amounts of spatial data. Spatial analysis of these data is becoming an inevitable tool for engineers around the world. The level of development of software tools makes it possible to convert traditional GPR survey results into large arrays of spatial data, and examples of such transformations are demonstrated in this study
2) As part of the study, spatial data from the results of GPR surveys were combined and compared both with cartographic substrates and with a cloud of laser scanning points. In addition, examples of comparative spatial analysis of such data with each other are demonstrated
3) Using the generally accepted criteria in GPR for detecting anomalous types of records on radargrams and the possibility of spatial analysis, weakened zones were found at the base of the pavement of highways and the places of potential deformations of the road surface were predicted
4) The spatial relationship of areas of high signal amplitudes according to GPR survey data and visual signs of pavement defects in the laser scanning point cloud clearly demonstrate the possibility of detecting weakened zones in the base of pavements based on the results of GPR works
5) The spatial relationship of GIS layers with data on the geometry of pavement layers and signal reflection amplitudes in them also makes it possible to predict the places of potential pavement deformations
.
Thanks
We express our special gratitude to the honored teachers of Moscow State University M.V. Lomonosov Vladov M. L., professor, head of Department of Seismometry and Geoacoustics, and Starovoytov A.V., Associate Professor of the Department of Seismometry and Geoacoustics for a huge contribution to the development of the GPR method, valuable ideas and experience in processing and interpreting GPR data
.
Bibliography
1. B. Tierney “Data Science. Basic course" // Alpina Digital. – 2018, 220 pages
2. Starovoitov A.V., Pyatilova A.M., Shalaeva N.V., Kalashnikov A.Yu. Void detection by ground penetrating radar // Engineering surveys. 2013. No. 13. pp. 26-33
3. Road survey with GeoReader software / Company LLC "TIM": site. URL: https://geotim.ru/portfolio/obsledovanie avtomobil-nyh-dorog/ (date of access: 04/03/2023)
4. Kulizhnikov A. M., Belozerov A. A., Burda S. N. Detection of defects in subgrade and underlying soils using GPR technologies // Actual problems of modern road construction and economy: materials of scientific-practical. conf. - Vologda: VoGGU, 2002. S. 73-77.
5. Starovoitov A.V. Interpretation of GPR data: a tutorial. - M .: Publishing house of Moscow State University. - 2008. - 192 p
6. Vladov M.L., Sudakova M.S. Ground-penetrating radar. From physical foundations to promising directions. Tutorial. - M .: Publishing house "GEOS". - 2017. - 240 p