Presentation of version GeoReader v2.4
In version v2.4 GeoReader Software an opportunity presentation areal GPR survey on the amplitude maps. From the planned improvements - a performance logging system has been added, the format of the GRT-2X georadiotomograph (Terrazond) has been updated, bugs of version v2.3 have been fixed
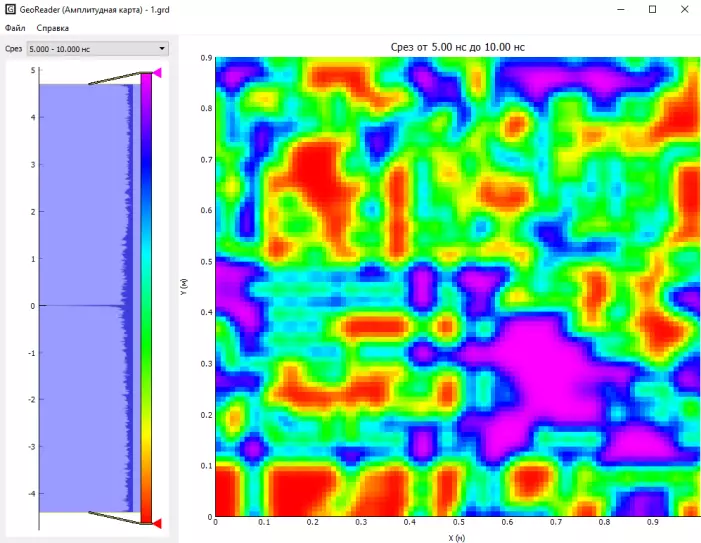
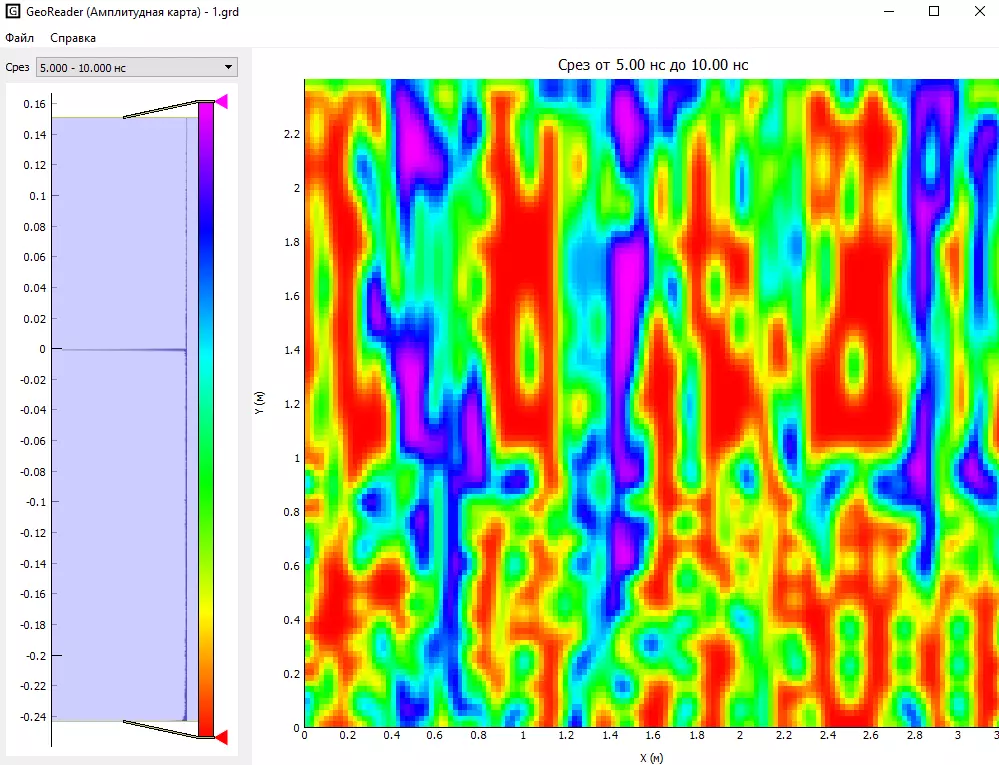
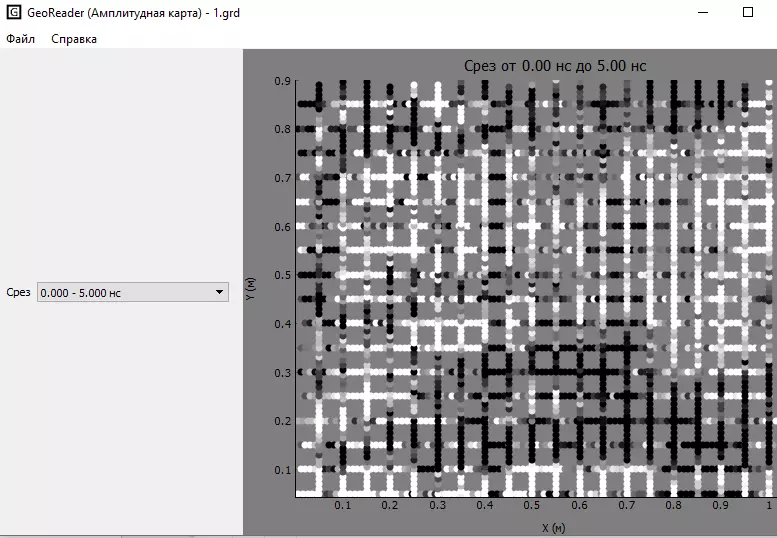
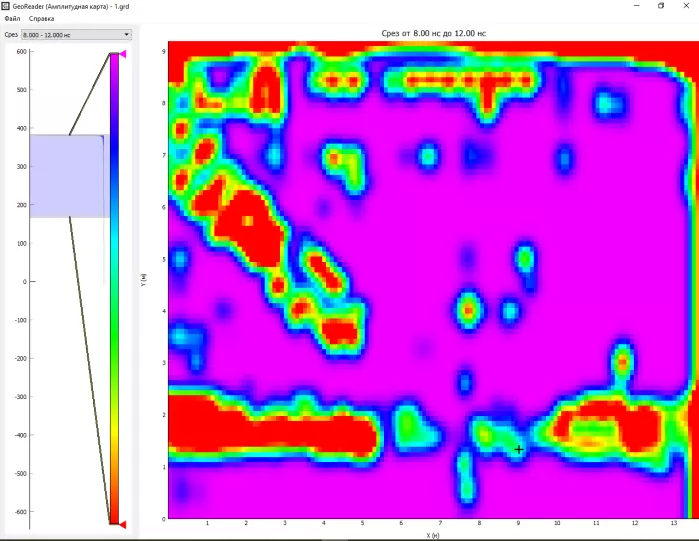
GeoReader AmplitudeMap module builds amplitude maps areal GPR survey

The working window of the module consists of three areas: 1 - Select the time slice, 2 - histogram 3 - amplitude map
A bit of theory..
In the case of using three-dimensional GPR, or during a GPR survey with a grid of longitudinal and transverse profiles, there is a problem of three-dimensional analysis of the results of GPR survey. In this case, preliminary processing of radarograms is performed separately, after which all radarograms are reduced and displayed either in the form of a 3D cube or in the form of amplitude maps

Amplitude maps are converted reflections from adjacent profiles, which are collected from closely spaced rows of antenna sections, recalculated, compared and referenced to the grid. These images provide an accurate three-dimensional picture of reflective surfaces, showing the location of objects in space (in x and y dimensions) and with depth (z). Subsequently, it is possible to interpret these GPR slices
Three-dimensional analysis of radarograms is used, as a rule, when examining areal objects (construction sites, etc.), when searching for underground communications, examining road pavements of highways, etc.
Examples of radarograms converted to GeoReader AmplitudeMap


We invite you to get acquainted with the trial version of GeoReader software for free!


